On This Page
SecureChange Dashboard
Overview
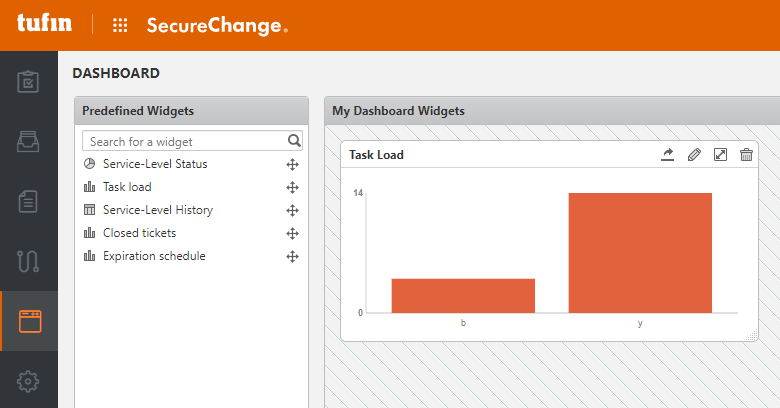
The SecureChange dashboard lets you use configurable widgets to graphically show important SecureChange ticket statistics.
The dashboard is available to users with the View reports permission. The dashboard layout is saved for each user.
The widget types are:
- Service-Level Status: Pie chart displaying the number of open tickets in each service-level status. Configurable for a specific workflow or for all workflows.
- Task Load: Bar chart displaying the number of assigned tickets to each handler. Configurable for top eight handlers, bottom eight handlers, or up to eight specified handlers. Only handlers with the permission View Tasks tab and handle tickets are displayed.
- Service-Level History: Bar chart displaying the number of closed tickets that met SLA and that were overdue, during each time segment in a configurable time frame. Configurable for a specific workflow or for all workflows.
- Closed Tickets: Bar chart displaying the number of tickets closed during each time segment in a configurable time frame. Configurable for a specific workflow or for all workflows.
- Expiration Schedule: Bar chart displaying the number of closed tickets with unrevoked request expiration dates in each time segment in a configurable time frame. Configurable for a specific workflow or for all workflows.
You can add the same widget type multiple times to the dashboard, and there is no limit to the number of widgets that can be placed in the dashboard.
The Dashboard Essentials extension provides a suite of more granular analytics tools, each focused on specific goals that your organization may have. The visuals are intended to help you monitor progress across time and can be easily exported in PDF form to document progress or report out to stakeholders. For more information, see Dashboard Essentials.
What can I do on this page?
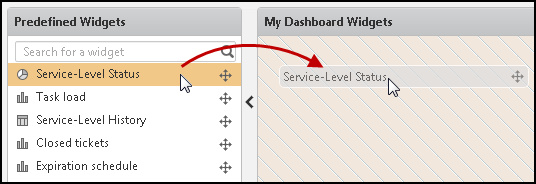
- Add a widgets to the dashboard - Drag a widget type from the list of predefined widgets onto the dashboard.

-
Arrange widgets in the dashboard - Click the white space of a widget and drag it to any location on the dashboard.
-
Edit a widget - In a widget, click
 . In the popup window you can:
-
Edit the name of the widget
-
Change the filters for the widget data
- Service-Level Status - Specify the workflow for which you see the summary of the service-level status
- Service-level History - Specify the workflow and the period of time for which you see the summary of the service-level history
- Task Load - Edit the filter to include specified users or groups
- Closed Tickets - Specify the workflow and the period of time for which you see the summary of closed tickets
- Expiration Schedule - Specify the workflow and the date range for which you see the expiration schedule
-
-
Resize a widget - Click-and-drag an edge of the widget to change the size of the widget.
-
Maximize a widget - Click
 to open the widget in a large popup window.
 -
Save a widget as an image - Click
 to download the widget image as a PNG file.
 -
Delete a widget - Click
 to delete the widget.
 -
Drill-down to the widget details - Click a section of the widget data to open a table that shows the list of tickets. You can enter text in the filter field to show only tickets that contain the entered text in the Subject or Assigned to fields.
-
To sort the results:
-
To sort by one criteria, click the column heading by which to sort.
-
To sort by more than one criteria, click
 in the column to sort by and select Ascending or Descending. Each additional column that you sort by is marked as an additional sorting criteria, in order.
Click
 again to change the sort order or to remove sorting from the column.
-
-
To export the results, click
 and select to export the visible data or all data to a CSV file.
When exporting to a CSV file, or XSLX file, if a special character ( = - + @ ) appears at the beginning of any field, a single quote (') is automatically added before the character. -
-
Hide the predefined widgets - Click
 to hide the list of predefined widgets.
Change Dashboard Polling and Indexing
In Settings > Miscellaneous, you can change:

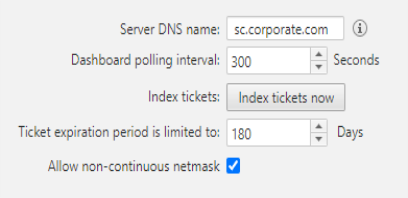
- Dashboard polling interval: How frequently the dashboard is updated with new ticket information
- Index tickets now: Manually force the database to re-index tickets
How Do I Get Here?
SecureChange > Dashboard ![]()
