On This Page
597Creating/Generating a Rule and Object Usage Report
Overview
The Rule and Object Usage Report displays statistics for most-used, least-used and unused rules and objects. For each rule or object, it calculates the amount of logged network traffic that was passed or blocked.
For more information, see Rule and Object Usage Report.
What Can I do Here?
Create a Rule and Object Usage Report
-
Click New Report.
The report configuration wizard has three parts.
- General Criteria:
-
For Report Type, select Rule and Object Usage.
-
You can change the Title. By default, the report name is the report's general name with the current date.
-
In a Multi-Domain environment, select the Domains that contain the devices on which you want to run the report.
-
Select Devices for the report.
-
If you selected one domain, you can limit the report to include specific devices in the domain.
-
If you selected more than one domain, then Any is selected for Devices, and all devices in the selected domains are included in the report.
-
-
For Check Point devices, if you have selected one device, you can limit the report to include specific Policy Packages.If you have selected more than one device, then Any is selected for Policy Packages and all policy packages in the selected devices are included in the report.
-
Click Next.
-
-
Specific Criteria:
-
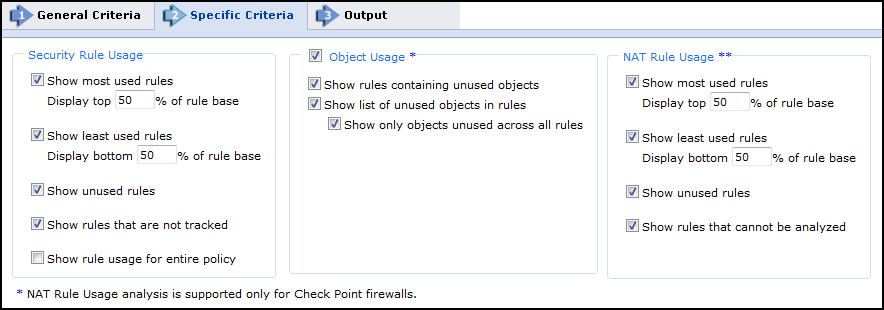
Select the statistics should be included in the report:
-
Security Rule Usage:
Parameter
Description
Show most-used rules Security rules with the most logged traffic in the rulebase during the specified time. Enter how many of the most used rules (what percentage of the rulebase from the top) you want displayed.
From a performance perspective these rules should be as close as possible to the top of the rulebase, to shorten the rulebase lookup time on the gateway.
Show least-used rules Security rules with the least logged traffic in the rulebase during the specified time. Enter how many of the least used rules (what percentage of the rulebase from the bottom) you want displayed.
From a performance perspective these rules should be as close as possible to the bottom of the rulebase, to enable faster rulebase lookup time of other rules on the gateway.
Show unused rules Logging security rules that have not logged traffic during the specified time.
These rules may no longer be required, may pose a security risk, and should be considered as candidates for removal.
Show rules that are not tracked Security rules for which usage information is unavailable. For example, Check Point or Juniper rules that have None specified in the Tracking column. These rules are not accounted for in the firewall's logging mechanisms, with no record being kept for connections on these rules.
From a best practice perspective, IT departments should turn off logging only for rules that generate an excessive amount of traffic, and therefore strain the logging servers. Otherwise, all other rules should be logged.
Note: In some cases, this kind of rule may have a hit count: For example, if it once was logged and no longer is; or, if a Check Point rule is set not to log, but is logged because of a Global Properties setting.
This setting determines only whether these rules appear in an independent section. If such a rule has a hit count, it still may appear in other sections of the report.For Cisco firewalls, usage information is available for all rules, regardless of the logging settings.
Show rule usage for entire policy
Show usage statistics for all rules in the policy, not just the categoriesabove .
-
Object Usage: When logging security rules, usage information appears for each element in source, destination, and service fields.
Parameter
Description
Show rules containing unused objects When logging security rules that have more than one element in the source, destination or service field, the unused elements are highlighted. These objects are candidates for removal, to remove possible security holes and to reduce processing effort required by the firewall. Show list of unused objects in rules
An additional section is added to the report, listing network and service objects that are unused in the context of one or more logging rules. For each such object, the report lists the rule in which the object is unused, and the group in which it appears in the rule. To limit this section to objects that are unused in all rules, select Show only objects unused across all rules. -
NAT Rule Usage:
Only PDF and HTML formats include NAT rule statistics for the supported vendors.
Parameter
Description
Show most-used rules
NAT rules with the most logged traffic in the rulebase during the specified time. Enter how many of the most used rules (what percentage of the rulebase from the top) you want displayed.
From a performance perspective, these rules should be closer to the top of the rulebase, to shorten the rulebase lookup time on the firewall.
Show least-used rules
NAT rules with the least logged traffic in the rulebase during the specified time. Enter how many of the least used rules (what percentage of the rulebase from the bottom) you want displayed.
From a performance perspective, these rules should be closer to the bottom of the rulebase, to enable faster rulebase lookup time of other rules on the firewall.
Show unused rules
NAT rules that had no logged traffic in during the specified time.
These rules may no longer be required, may pose a security risk, and should be considered as candidates for removal.
Show rules that cannot be analyzed
NAT rules that are translated to "original" in source, destination, and service will be marked as "cannot be analyzed" and will not be analyzed in the report, because no NAT translation occurred.
-
-
Click Next.
-
-
Output:
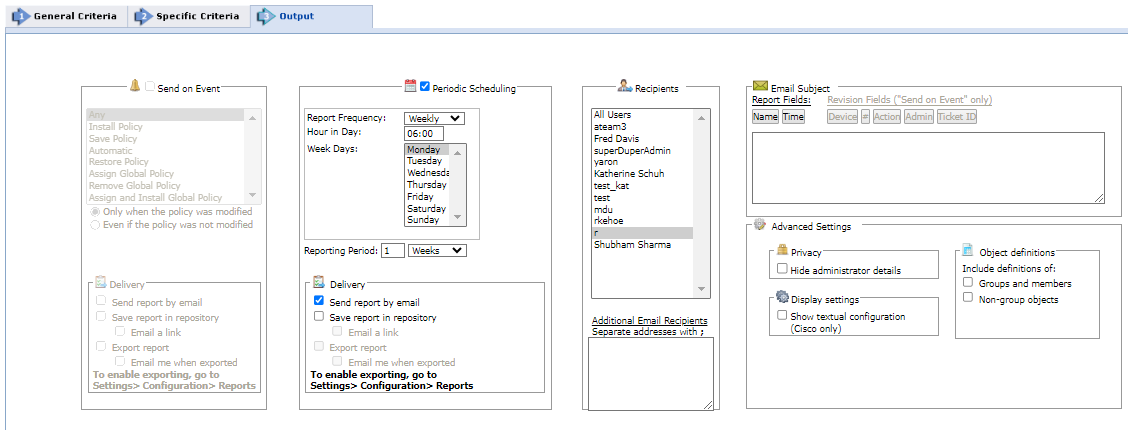
For this report, note that Send on Event is disabled.-
Configure the fields:
Parameter
Description
Send on Event
Select the events to trigger this report. You can use the <shift> key to select more than one event.
Select one of the following, to decide whether to always run the report after the event, even when there are no changes:
- Only when the policy was modified: Only if there are changes to be reported on, relative to the previous revision.
- Even if the policy was not modified: If there are no changes, the report will state that there were no changes. For example, if an administrator first saves a Check Point policy, and then installs the policy on a gateway a few minutes later, the second event has not modified the policy.
Delivery
The report can be delivered in any of the following three ways:
- Send report by email: The report is generated for each of the selected Recipients and emailed to them. The emailed report's formatting (embedded HTML, MHT attachment or PDF attachment) is globally configurable for all users.
- Export report: This option is available only to SecureTrackAdministrators, and only when enabled in the Reports page.A report is generated according to the owner's configured preferences and permissions, and exported according to the configuration in the Reports page. To be notified when a report is generated, select Email me when exported.
- Save report in Repository: The report is saved and users can later view it by selecting the Reports Repository tab (in Report view). Select Email a link to have a link to the report sent to recipients when a report is generated, provided the recipient's email is configured.
Periodic Scheduling
Defines a recurring schedule for report generation. The report can be generated on a daily, weekly, or monthly basis.Reporting Period controls how far back the report will span from the time of generation.
Recipients
Recipients: The SecureTrack users who receive the report (or a link or notification). When a SecureTrackUser creates a report, only that User is a recipient. When a SecureTrack Administrator creates a report, multiple recipients can be defined. These Recipients are SecureTrack Administrators or Users whose email addresses have been configured in SecureTrack. Other email addresses can be defined, separated by semicolons ( ; ) in the Additional Email Recipients text box.
Notes:
-
SecureTrack does not send the report if a specified recipient does not have permission for a device or Domain included in the report configuration when the report is generated.
-
In a Multi-Domain environment, administrators (Super and Multi-Domain) can only add users who have permissions for the current Global or Domain context.
Additional Email Recipients
Enter additional email recipient addresses. Separate the addresses with a semicolon (;).
Note: SecureTrack does not send the report if a specified recipient does not have permission for a device or Domain included in the report configuration when the report is generated.
Email Subject
You can click the field buttons to add the fields to the subject line of the email notifications.
- Report Fields: You can include the name of the report and the time that the report was generated.
- Revision Fields: When the report is configured to Send on Event, you can include the name of the device, the revision number, the action that triggered the notification, the name of the administrator who did the action, and the ticket ID associated with the change in the new revision.
Advance Settings
Privacy
- Hide administrator details: The report does not include the names of users that made changes to policies or the name of the report creator.
Display Settings
- Show textual configuration (Cisco only) (when ticket ID recognition is configured): If selected, the rule Name and Comment fields are removed from the report results. Only the ticket ID is included. This is useful if ticket comments contain confidential information that should not be sent to report recipients, such as administrator details.
Object definitions
- Groups and members: The report includes the definitions of group objects and their member objects. This is useful for recipients that do not have SecureTrack access. SecureTrack users can click group objects in the report to see the definitions.
-
Non-group objects: The report includes definitions of non-group objects.
-
Click Save.
The saved report appears in the General Reports list from which you can Run (
 ), Edit (
 ), or Delete (
 ) it.
) it.
-
Generate Report Results
This procedure is not applicable to PCI DSS Reports.
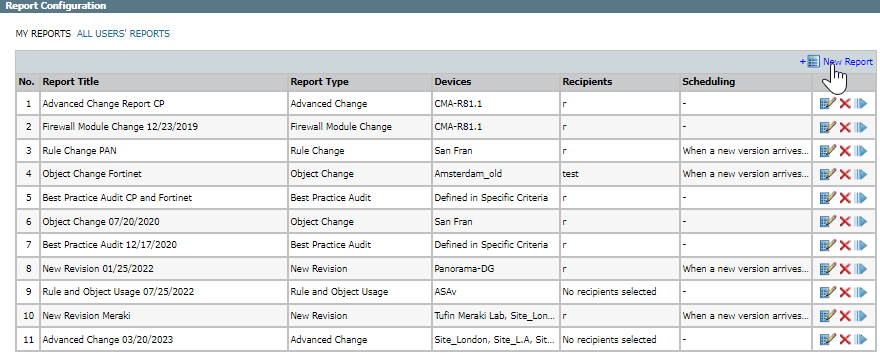
- Select General Reports.
A list of configured reports available for the connected user appears. Each line in the table displays basic information for one report: the report's title, type, relevant devices, recipients and scheduling.
-
Click
 for the report.
 -
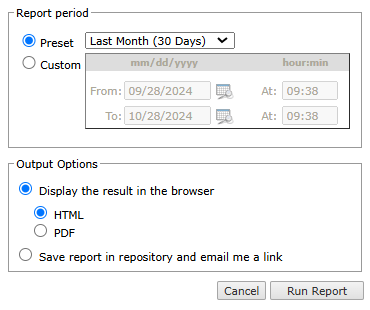
Configure the following.
-
Report Period: The time period for the report.
-
Preset: Select a preset period from the list.
-
Custom: Complete the fields that determine the custom period.
-
-
Output options: Determines the report display and how it should be saved:
-
Display the result in the browser: View the result now, as either HTML or a PDF.
-
Save report in repository and email me a link: You can review report results, which are saved in the repository, at any time using the link in an email message.
-
-
- Click Run Report.
The report is generated.
Usage Report Error: Waiting for initial policy installation
If the Rule and Object Usage report produces this error message, it is because SecureTrack needs to receive a policy revision with an Install Policy action for each Check Point management server. Once this has occurred, run the Usage report again.
How Do I Get Here?
SecureTrack > Reports ![]() > General Reports
> General Reports


