On this page
SecureTrack Dashboard
Overview
The SecureTrack Dashboard is the default opening page. It includes widgets that summarize key information about the rules and devices monitored by SecureTrack.
The page makes it easy to see if there are any rules or devices that require your attention and makes it easy to open the Rule Viewer with detailed information.
Click many of the elements on the Dashboard to open the Rule Viewer with a filter applied to view details of the items listed on the widget. The shortcuts to the Rule Viewer use pre-defined TQL searches. If required, after you open the Rule Viewer, you can modify the TQL search parameters to get the specific data that you require.
The Dashboard Essentials extension provides a suite of more granular analytics tools, each focused on specific goals that your organization may have. The visuals are intended to help you monitor progress across time and can be easily exported in PDF form to document progress or report out to stakeholders. For more information, see Dashboard Essentials.
Dashboard widgets
The Dashboard includes these widgets.
General
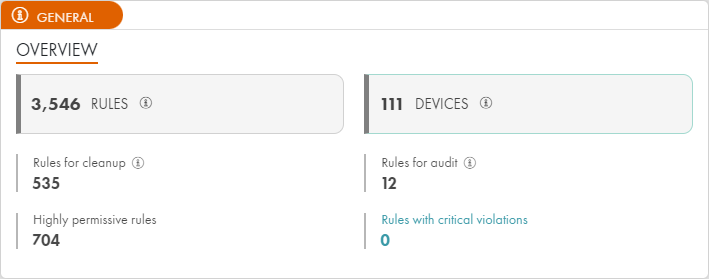
The General widget provides a general overview of the system:
-
Number of rules: The total number of rules monitored by SecureTrack.
-
Rules for cleanup: The number of rules that have been disabled, are fully shadowed, or have not been hit in the past year. These rules are candidates to be deleted.
-
Highly permissive rules: The number of rules with a permissive level of "High". These rules are potential security risks and may need to be modified. A rule is defined as highly permissive if the Source, Destination, or Protocol is "ANY".
-
Devices: The number of devices monitored by SecureTrack. Click to open the Device Viewer.
-
Rules for Audit: The number of rules with expired certifications or at least one expired ticket.
-
Rules with critical violations: The number of rules with critical violations. The definition of "critical" is defined in the USP.
Rules for cleanup
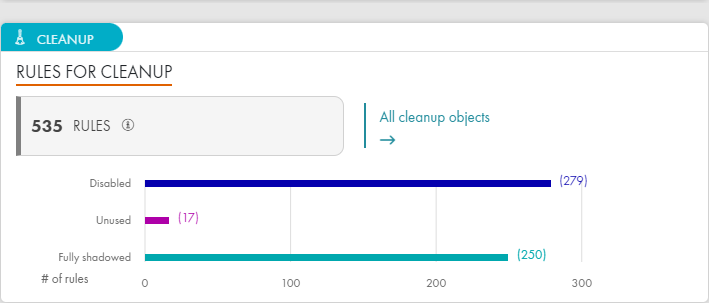
The Cleanup widget summarizes the number of rules that are disabled, fully shadowed, or have not been hit in the past year. These rules are candidates to be deleted. Click the number of rules or one of the colored bars to open the Rule Viewer with a filter applied to view the rules that are candidates for cleanup. Click All cleanup objects to open the Cleanup Browser.
Cleanup trends
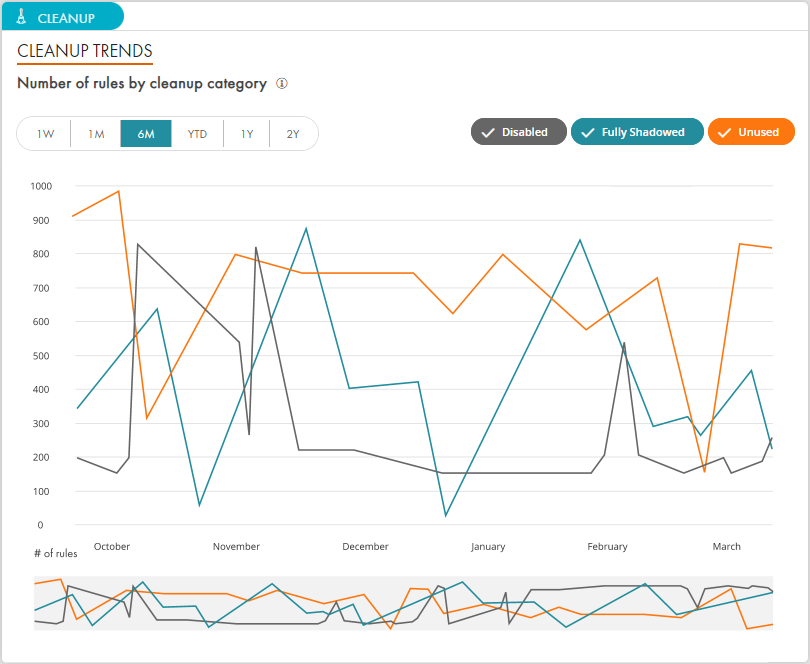
The Cleanup Trends widget shows how many rules were candidates for cleanup each day over a selected period of time, this allows you to see whether there is a change or improvement in the number of disabled, shadowed, or unused rules over time. The trend is calculated once a day, so data for the current day is not displayed. Click a point on a line to view a complete list of current rules for cleanup in the Rule Viewer. Use the gray bar at the bottom of the widget to zoom in to a specific time range.
Cleanup - rules for optimization
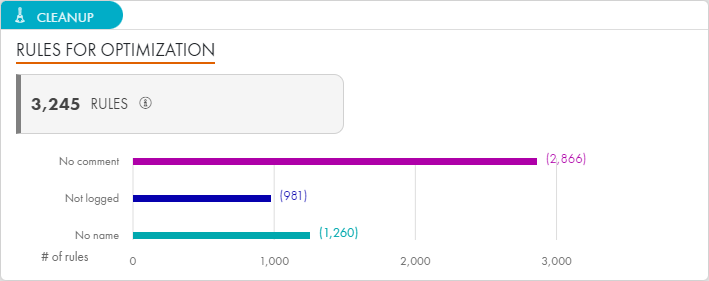
The Cleanup - Optimization widget shows the number of rules that can be optimized. Click the number of rules or one of the colored bars to open the Rule Viewer with a filter applied to view the rules that are candidates for optimization.
Rules for Optimization are classified as follows:
-
No Comment: It is recommended best practice to include a comment in rules on devices that support comments
-
Not logged: Rules that are marked as "not logged". These rules will not be included in the audit log
-
No Name: Rules that do not have a name configured.
USP compliance trends
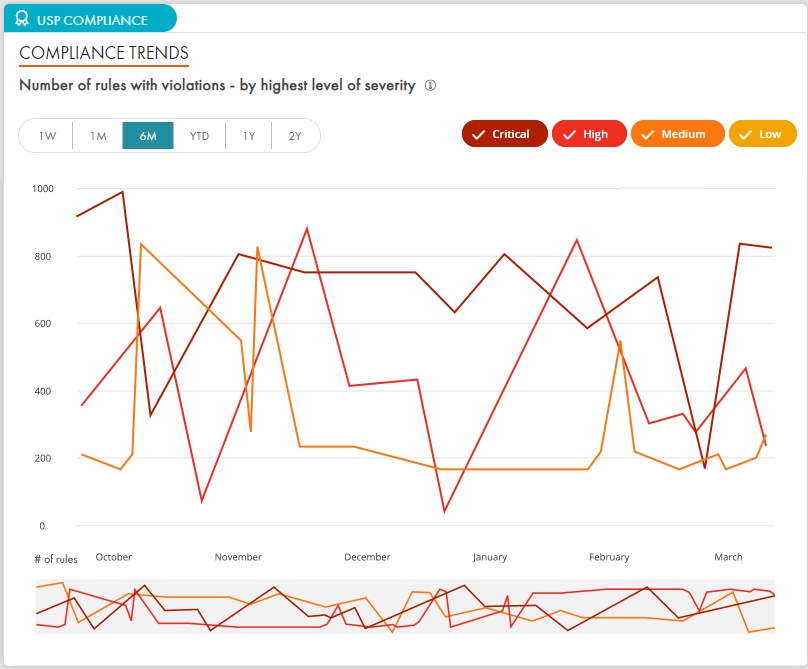
This widget displays the number of rules with violations on each day. Violations are divided into critical, high, medium, and low violations. The trend is calculated once a day, so data for the current day is not displayed. Click a point on a line to view a complete list of current rules with violations in the Rule Viewer. Use the gray bar at the bottom of the widget to zoom in to a specific time range.
USP compliance - rules with violations
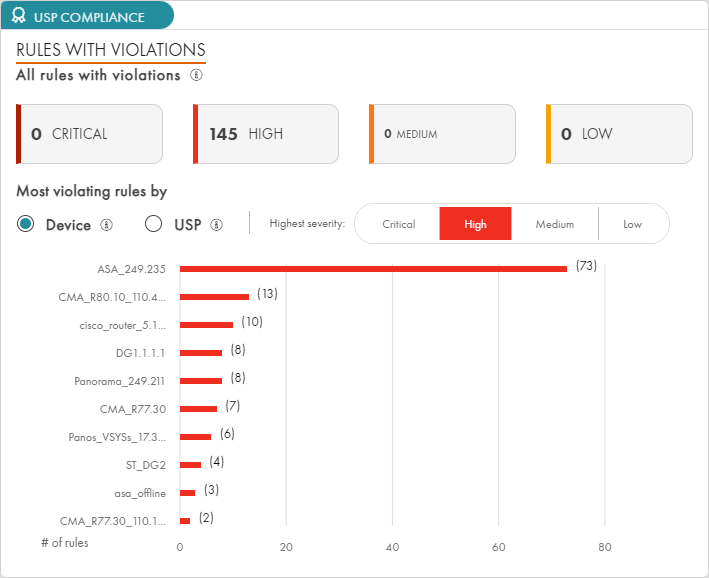
The USP Compliance widget indicates the number of rules with violations, according to their severity level. If there are no violations in the system, this widget is not displayed. You can view rules by device or by USP. Click a compliance level (Critical, High, Medium, or Low) to open the Rule Viewer with a filter applied to view relevant rules.
Audit
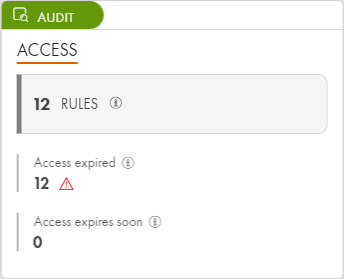
The Audit widget indicates the number of rules withe expired access or will have access expire within the next month. If SecureChange is installed, this widget also provides information about certification expiration.
Recent changes
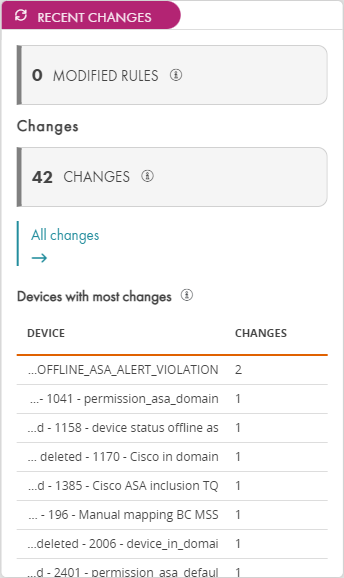
The Recent Changes widget lists the following:
-
Modified Rules: Rules which were modified in the past 30 days.
-
Changes: Changes in the past 30 days.
-
Unauthorized Changes: Unauthorized changes in the past 30 days. This information is only displayed if SecureChange is installed, it does not include information from Zscaler, Meraki, or GCP.
-
List of devices with the most changes in the past 30 days. If SecureChange is installed, this list includes only unauthorized changes.
Predefined queries
This Predefined Queries widget contains shortcut to common TQL queries in the Rule Viewer. If you need a specific query which is not listed here, you can hover over a query or click a query to see the TQL format in the Rule Viewer, and Modify the TQL search parameters as needed. This is a quick and easy way to use TQL to get the information that you require, even for users who do not have experience with the TQL search functionality.
This widget includes the following predefined queries:
-
Which rules should be cleaned up?
-
Which rules have a high permissiveness level?
-
Which rules were not hit in the last year?
-
Which rules have violations?
-
Which rules violate a specific USP?
-
Which rules are covered (fully or partially) by a specific exception?
-
Which rules should be recertified?
Side panel
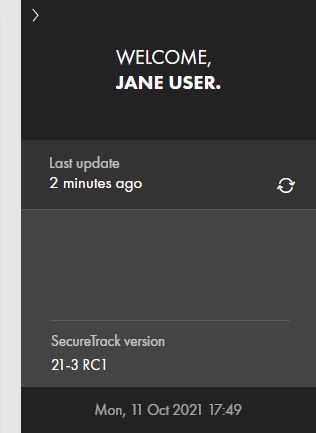
The right side of the Dashboard displays the user name, time since the dashboard was last updated, version number, and time on the server. Click > to hide this panel.
How do I get here?
SecureTrack > Dashboard ![]()
Was this helpful?
Thank you!
We’d love your feedback
We really appreciate your feedback
Send this page to a colleague
