On this page
Path Analysis
Overview
The path analysis feature allows you to investigate whether there is a path between selected sources and destinations, and which devices exist in the path which may block specific traffic. You can investigate a path based on specific services such as HTTP or SSH.
You can drill down to see details of the path such as the routes, interfaces, and matching policy rules of each device in a path. For physical devices, this allows you to see all devices in the path and the relevant routing information for the devices. For cloud platforms, you can analyze the virtual private clouds or networks to make sure that they are connected.
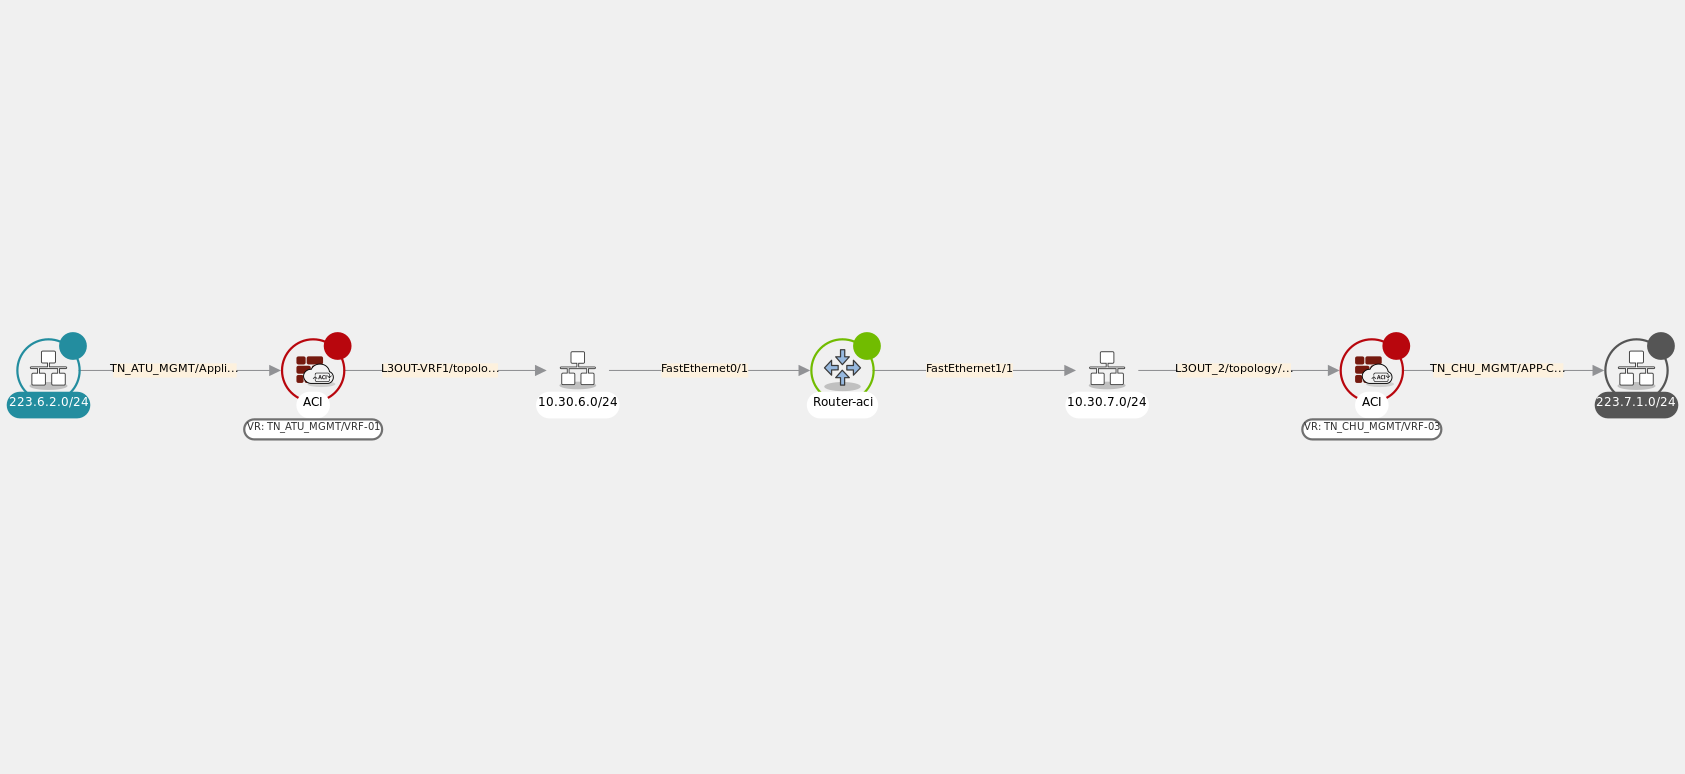
In the following example, path analysis identified the most direct route from the Source device 10.7.7.0/24 (identified with  ) to Destination 192.168.75.024 (identified with
  ). The devices marked in red include rules that will drop traffic.
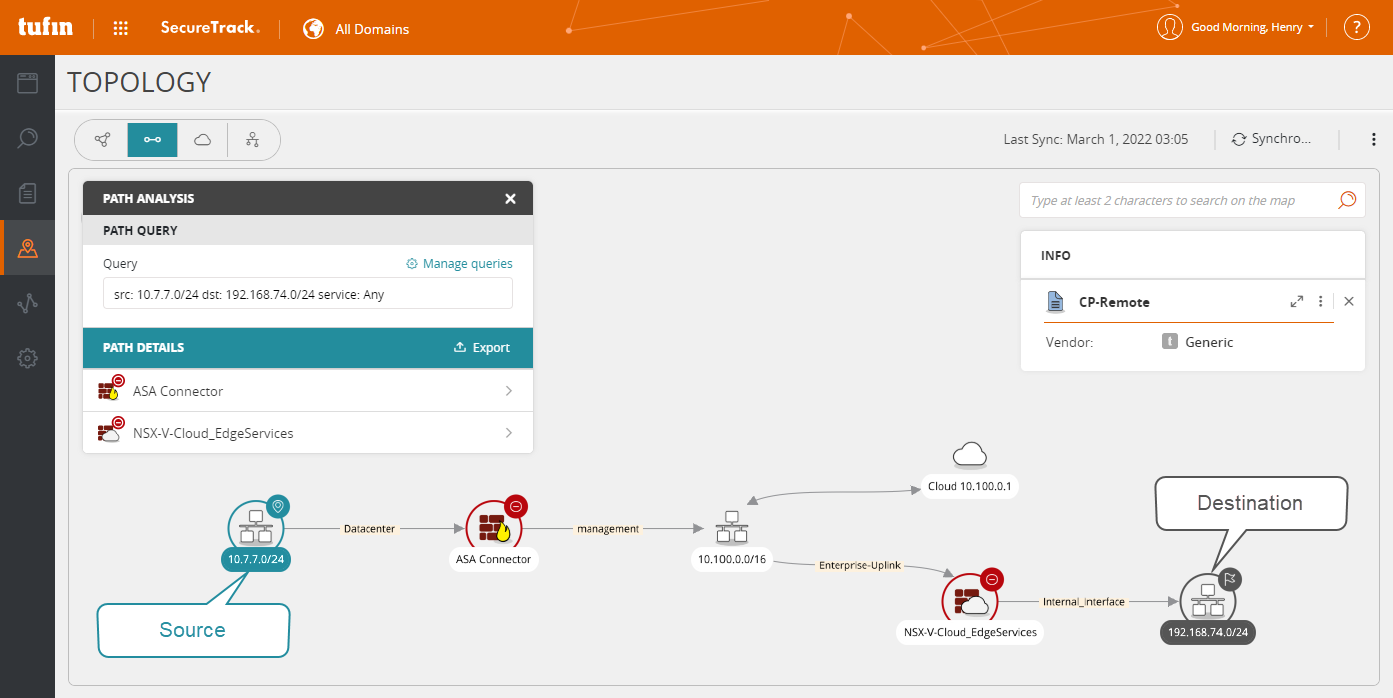
The map shows the selected path in the order of the minimum distance (least number of hops) from any source to any destination. Devices with an equal distance between the source and destination are listed in alphabetical order.
For a more detailed analysis, you can trace the route of the path and view what happens to the traffic on each step of the route.
Path analysis icons
The icons on a path analysis map are:
|
Icon |
Meaning |
Description |
|---|---|---|
|
|
Start point | First element that SecureTrack can identify in each path. If the start point is not in an identified network, SecureTrack shows the start point in a cloud. |

|
Routes traffic | Device that allows traffic. |

|
Drops traffic | Device includes a rule that blocks traffic. |

|
Incomplete path | Source traffic goes to this point, but does not reach the destination. |
|
|
End point | Last element that SecureTrack can identify in each path. If the next device in the path is an unmonitored device, SecureTrack shows the end point in a cloud. |
|
|
Directional arrow |
Direction of the modeled traffic (Traffic can also be bidirectional) |
|
|
NAT |
Device that uses NAT. |


If there is an incomplete path, the devices with missing routing data are colored black.
What can I do here?
Run a path query
-
Click
 . The Path Analysis panel appears.
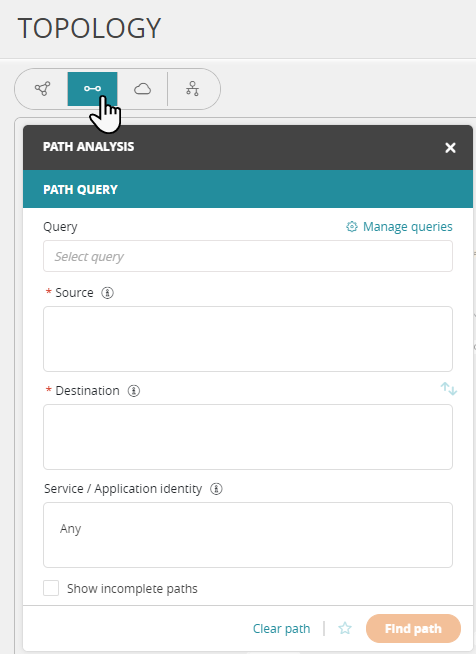
-
Enter one or more Sources and Destinations using any of the following methods:
-
Select a saved query and run it.
-
Right-click a device on the map and select Add to Source or Add to Destination.
-
Type the first few letters of the host, subnet, IP range, LDAP users, or group name and select the device from the auto-filled list.
-
IPv4 addresses are supported for all devices; and IPv6 is supported for specific devices. See SecureTrack Features by Vendor.
-
Path Analysis query supports a path that includes both IPv4 and IPv6 routes (hops).
-
For Palo Alto Panorama devices, enter a non-default port for applications by entering the port name in brackets, multiple ports should be separated with a comma, for example
Facebook(TCP 100, TCP 101, HTTP). -
To enter a user group, type user.name in front of the group. For example: user.name/QA-devices.
-
To enter an FQDN object, type the FQDN name, for example
tufin.com. The FQDN name is resolved when TOS retrieves revision data. TOS also uses existing DNS information, but this requires an external lookup.
-
Path queries for Check Point targets cannot contain LDAP and other object types together in the same source field. Instead, you must create separate queries for each source type. -
-
(Optional) In the Service / Application identity field, enter (lowercase) services / application identities (see predefined services, predefined application identities).
-
(Optional) Select Show incomplete paths to investigate incomplete paths.
-
(Optional) Select Trace Mode to trace the route of the traffic on each individual hop.
-
(From 5.2) Select the relevant Micro-Segmentation Check to view assets managed by Guardicore or Illumio:
-
Managed (default): The query will show assets managed by Guardicore or Illumio with an enforced firewall policy.
-
All: The query shows all assets.
-
None: The query does not perform a microsegmentation check on assets.
-
-
Click Find Path.
The Path Analysis panel displays devices in the path between the source and destination.

You can click a device to see details, including the incoming interfaces (for cloud, coming from) and the next devices (for cloud, going to).
tos config set -p topology.map.lazy.rendering=true -s topology-facadeTo view the map, click Load Map.
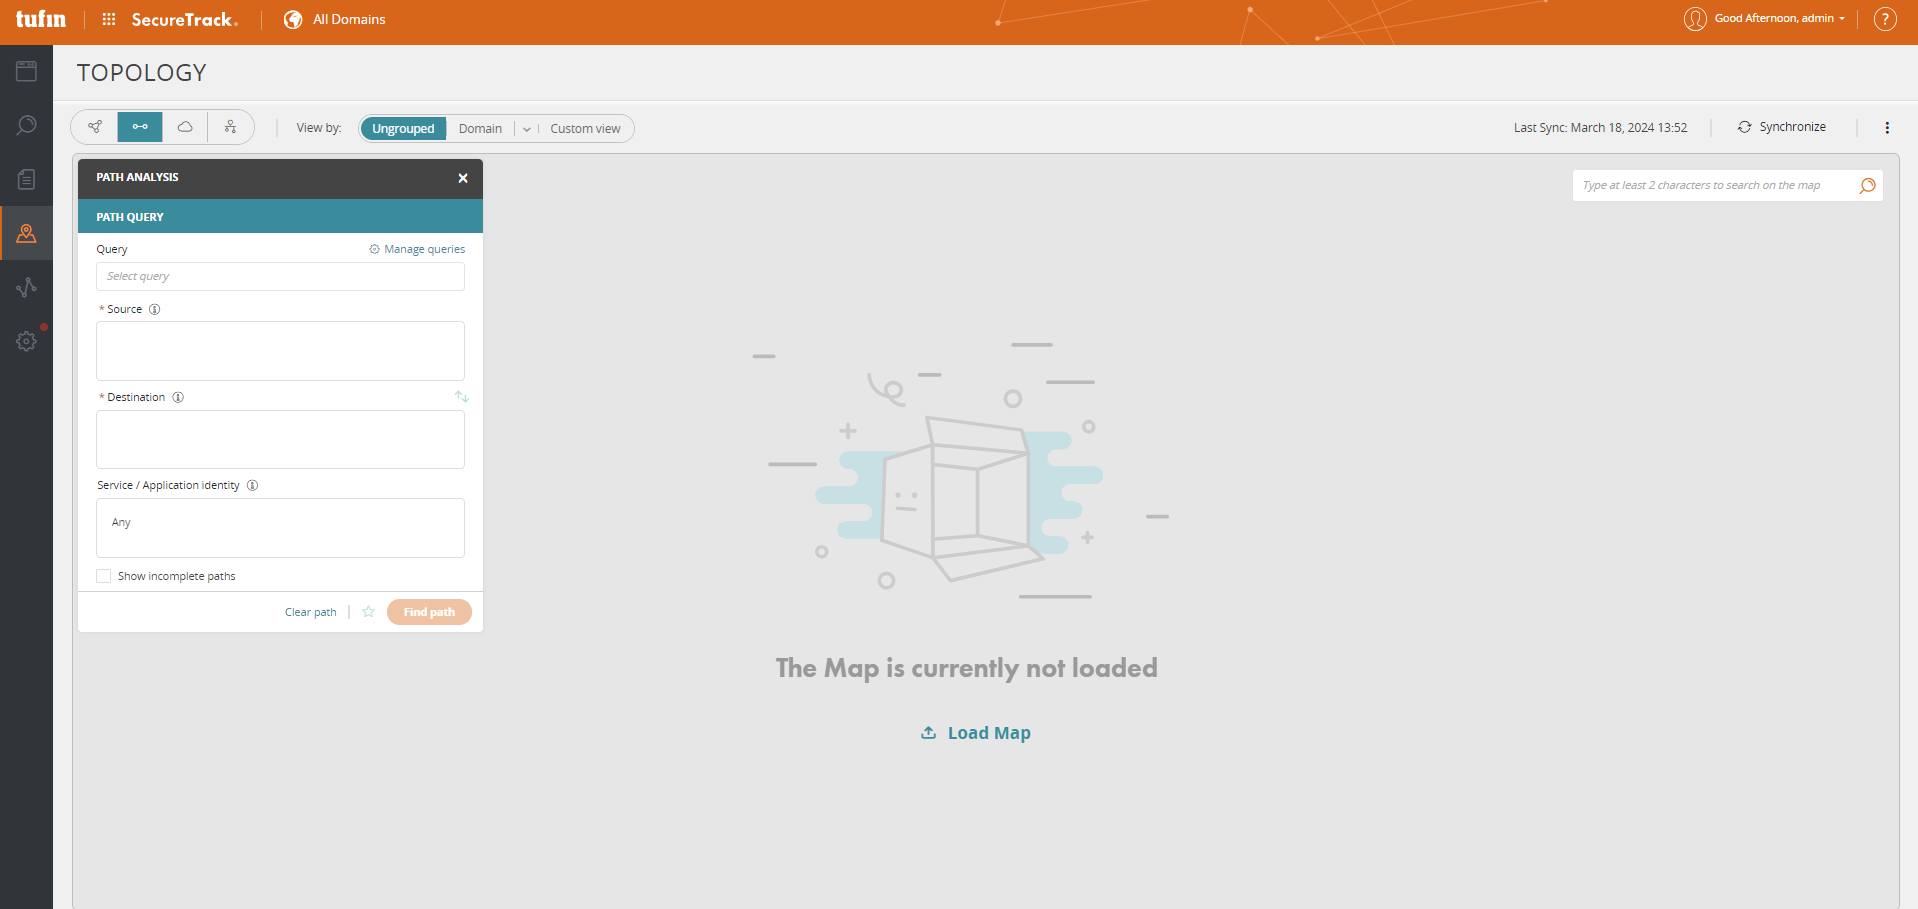
Search capabilities are unavailable when the map is suppressed.
Show routes for a monitored device
-
Run a path query.
-
Right-click a monitored device and select Show routes. The routes window appears.
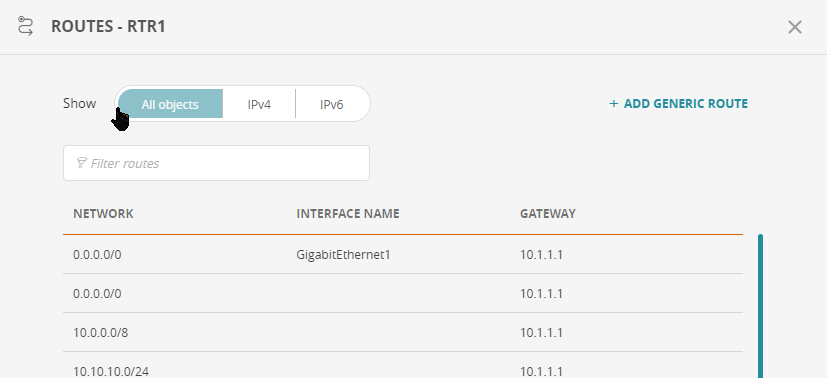
-
To filter the list, select All objects, IPv4 or IPv6, or enter text in the field Filter routes
-
To add a generic route, click + ADD GENERIC ROUTE.
Show interfaces of a monitored device
-
Run a path query.
-
Right-click a monitored device and select Show interfaces. The interfaces window appears.

-
To filter the list, select All objects, IPv4 or IPv6, or enter text in the field Filter interfaces
-
To add a generic interface, click + ADD GENERIC INTERFACE.
Show route-based VPNs for a monitored device
-
Run a path query.
-
Right-click a monitored device and select Show route-base VPNs. The route-base VPNs window appears.
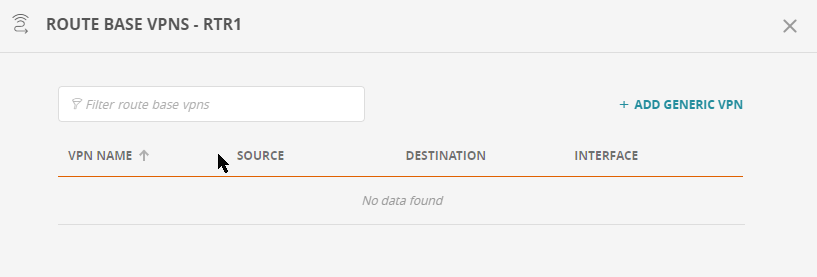
-
To filter the list, enter text in the field Filter route-base vpns
-
To add a generic VPN, click + ADD GENERIC VPN.
Show matching rules for a monitored device
-
Run a path query.
-
Right-click a monitored device that blocks traffic, and select Matching rules. The rules window appears.
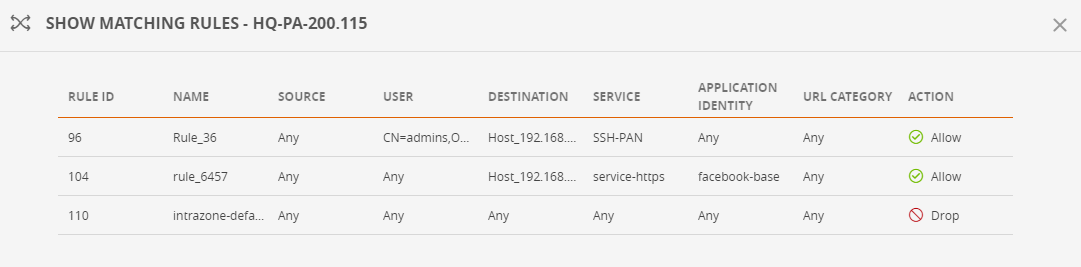
All rules that block the traffic are listed.
-
To filter the list, enter text (not available on all device types).
Export path report as a PDF file
Click Export next to the search result to generate a PDF report with details of the path, including matching rules, interfaces, and NAT information. If there are multiple paths, you can select which paths to include in the report. The report includes a map of the paths and details of each device in a path.

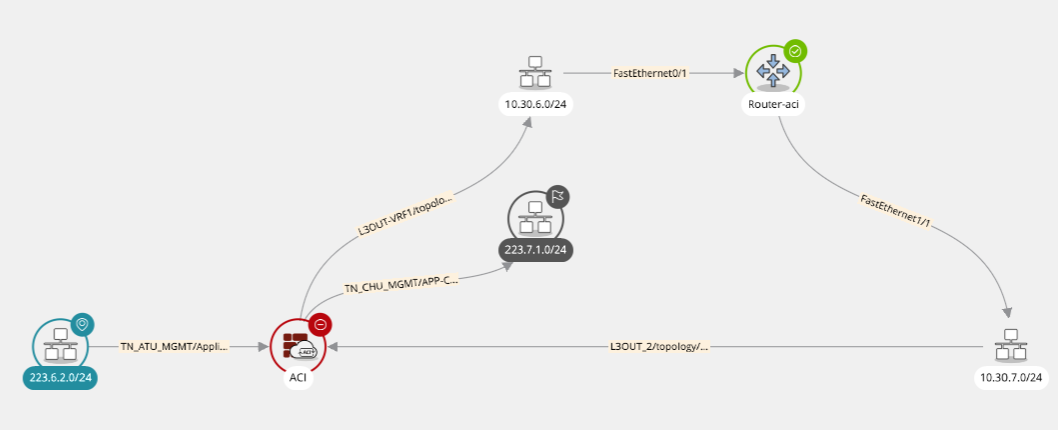
Investigate incomplete paths
An incomplete path is where there is no path between the source and destination
If path analysis is unable to identify a path, it give you the option to view an incomplete path which shows devices that the source can reach, but cannot continue to the destination without adjusting the device settings.
The grey items in the following image are connected to the source, which is colored blue, but cannot continue to the destination.
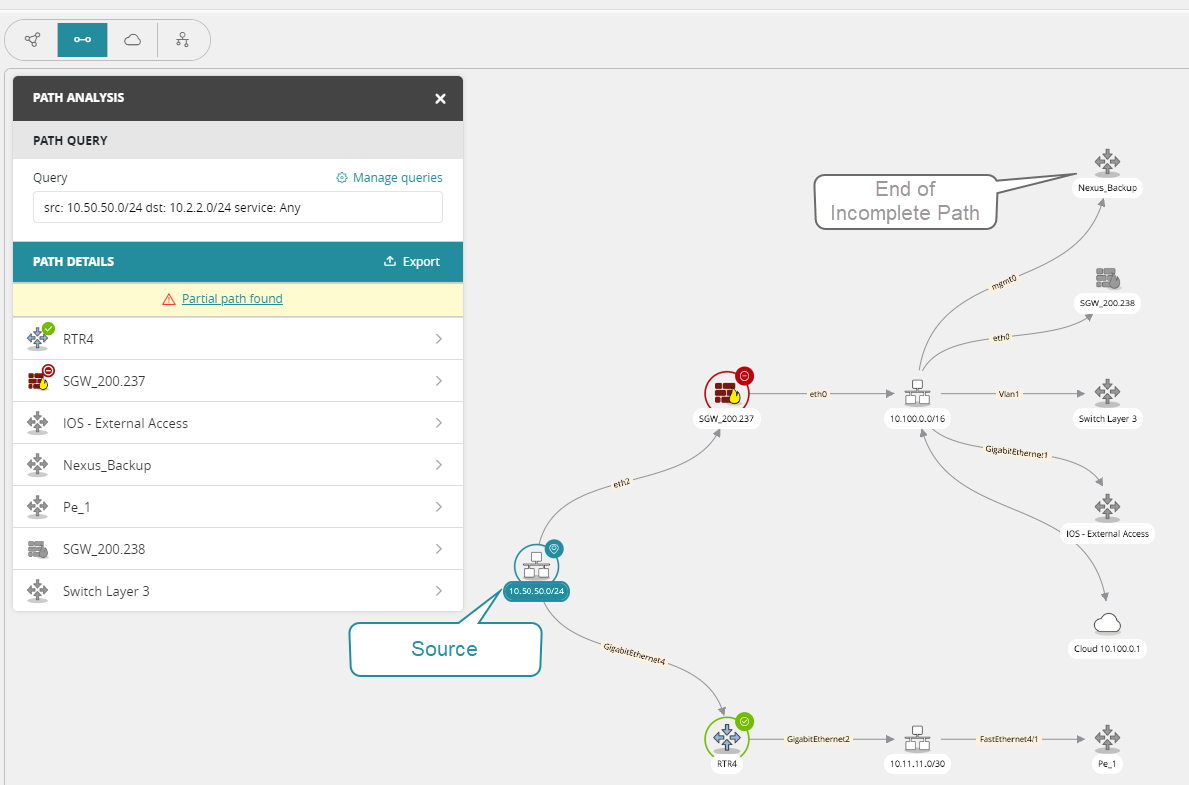
Investigate partial paths
A partial path is a path were a source has no path to one or more destinations.
In the Path Analysis panel, click Partial path found to view details of the partial path

SecureTrack displays a list of sources that have no path to one or more destinations:

Trace the route of a path
Path analysis results are sometimes complex with many hops and repeated segments.
Example
For a more detailed result, in the Path Analysis panel select Trace Mode to trace the route the traffic takes from source to destination.
Trace mode includes two views:
-
Complete View: Shows a complete view of the route including what happens along each step in the path.
-
Step-By-Step Analysis: Shows what happens to the traffic one hop at a time.
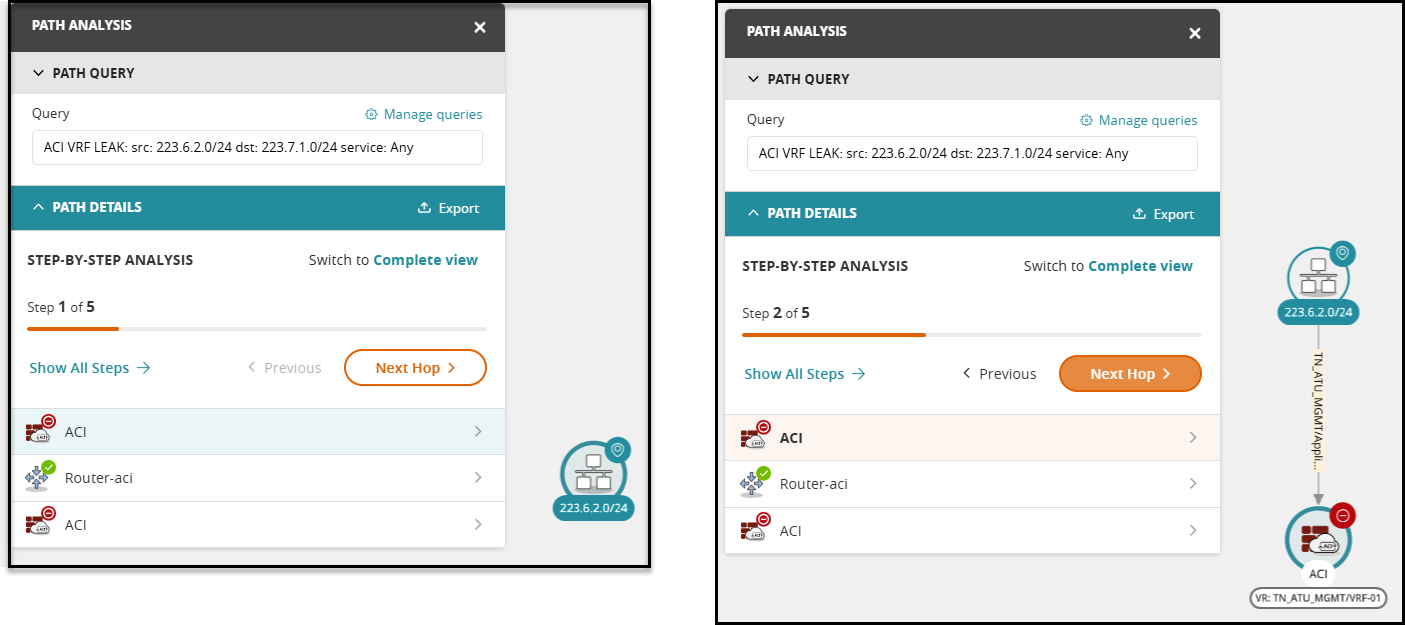
(image shows 2 steps out of 5)
Hovering over a device shows more detailed traffic information.
Export path as SVG image file
-
On the map, click Export Path Canvas to export the path analysis result as an SVG image file.
Save a query
-
Click Manage queries to create and manage path queries.
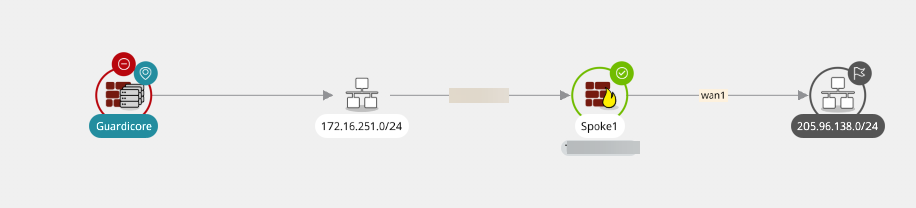
(From 5.2) Perform a Micro-Segmentation check
Micro-Segmentation Checks are used to evaluate assets managed by Guardicore or Illumio. When performing the evaluation, if the source or destination have an appropriate asset, the path will show the microsegmentation device on the path and evaluate the policy.
There are three options:
-
Managed (default): The query will evaluate assets managed by Guardicore or Illumio with an enforced firewall policy.
-
All: The query evaluates all assets (both managed and unmanaged).
-
None: The query does not perform a microsegmentation evaluation on assets.
Example 1:
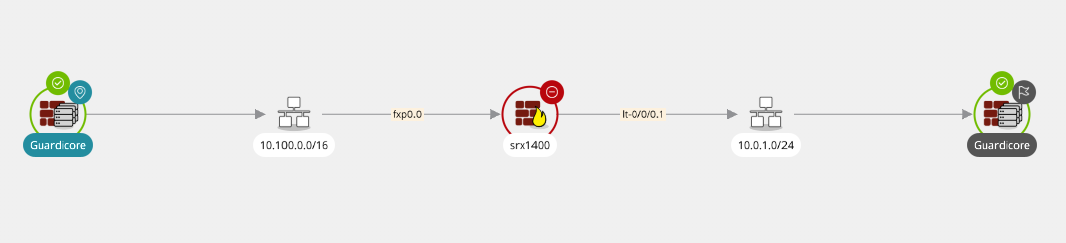
Example 2
-
The Guardicore/Illumio device is only displayed in the source or destination of the path.
-
The Guardicore/Illumio device is only displayed (with the allow/block verdict) when the source or destination IP address or host matches an asset managed by Guardicore/Illumio (in other words, an asset with an installed Agent).
-
Subnets, ranges, and sources/destinations with Any or Internet are never treated as assets. Therefore, if neither the source nor the destination has a specific IP address matching a Guardicore/Illumio asset, no Guardicore/Illumio device will appears in the path.
How do I get here?
SecureTrack > Map ![]()
Was this helpful?
Thank you!
We’d love your feedback
We really appreciate your feedback
Send this page to a colleague