On This Page
Rule Cleanup Dashboard
Overview
You use the Rule Cleanup dashboard tracks progress toward rule cleanup goals. Removing redundant or irrelevant rules can improve the performance of your firewall devices. Having specific, and well-crafted rules can improve the security posture of your network rule base overall, and helps achieve least privilege in network access.
This dashboard answers the following questions:
-
How messy is my network rule-base?
-
Is my rule-base becoming more complex or less complex across time?
-
Which devices may be under-performing due to a high number of redundant rules?
-
How has SecureTrack contributed to a reduction of messy rules in my network?
What Can I see Here?
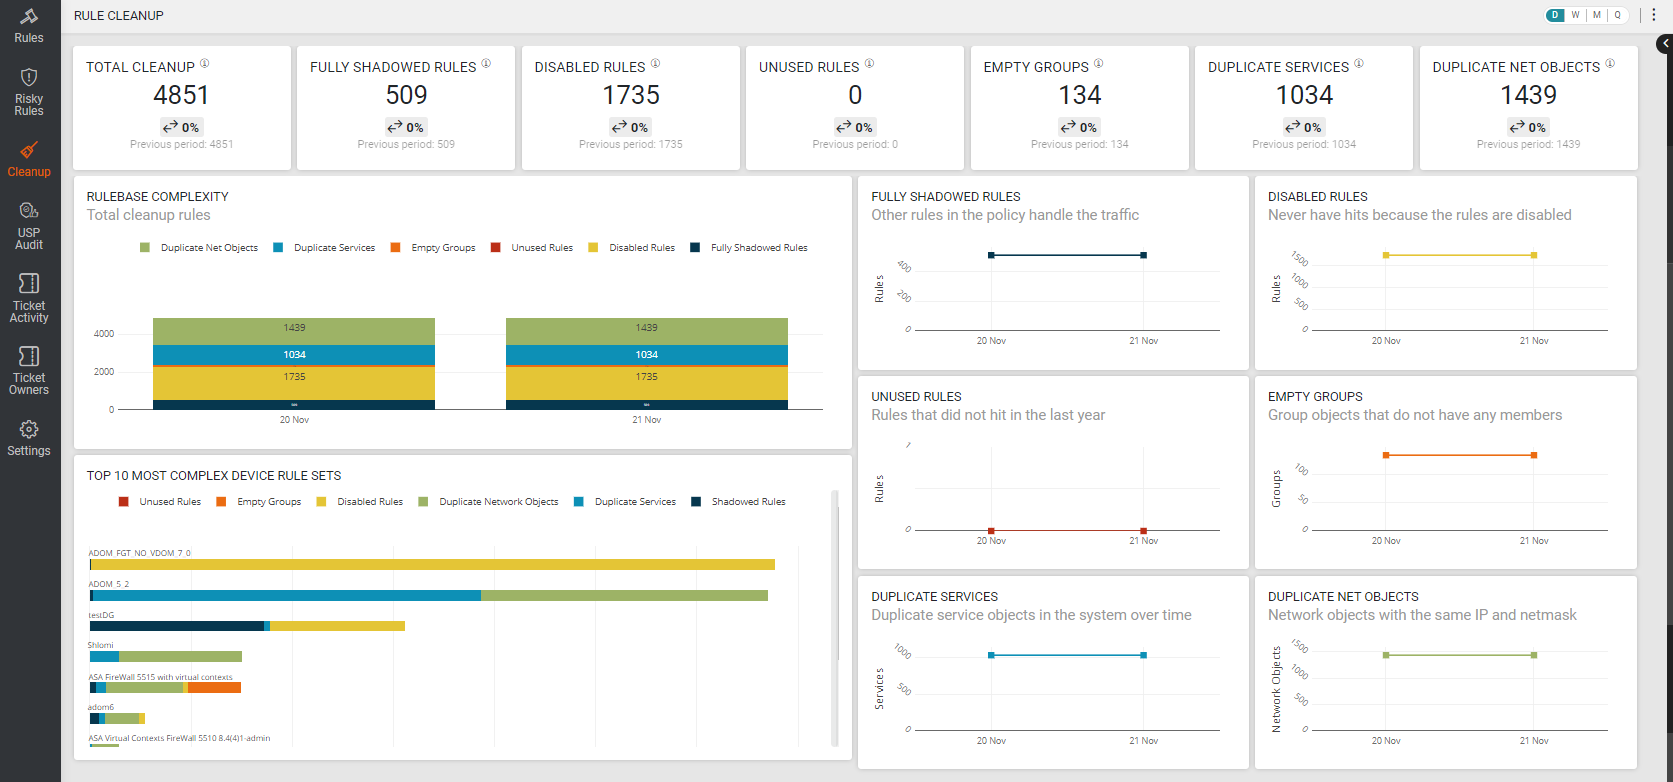
This dashboard shows totals, trends, and the delta from the last time that the data was collected for the following metrics:
-
Total Cleanup: Total number of fully shadowed rules, disabled rules, unused rules, empty groups, duplicate services, and duplicate network objects.
-
Fully Shadowed Rules: Total number of fully shadowed rules (rules for which other rules in the policy handle the traffic) identified by SecureTrack in the specified time frame.
-
Disabled Rules: Total number of disabled rules (rules that have no hits) identified by SecureTrack in the specified time frame.
-
Unused Rules: Total number of rules with no recorded hits in the past year.
-
Empty Groups: Total number of empty groups (group objects with no members) identified by SecureTrack in the specified time frame.
-
Duplicate Services: Total number of duplicate services identified by SecureTrack in the specified time frame.
-
Duplicate Network Objects: Total number of duplicate network objects (network objects with the same IP and netmask) identified by SecureTrack in the specified time frame.
Two additional panes include Rulebase Inefficiency (total number of cleanup rules) and the Top 10 Most Complex Device Rule Sets (top 10 devices with the corresponding number of rules for each metric).
What Can I do Here?
Use the Graphs
Slide the graph to see dates before or after the current view.
Highlight Bars
Hover on a bar in a bar graph to see the number of objects that match the corresponding color in the graph legend.
Change the Aggregation Setting
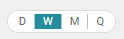
Select the setting (Day/Week/Month/Quarter) to determine the aggregation of the dashboard data.
Export Dashboard
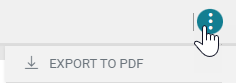
Select the Action list (![]() ) to export the dashboard to PDF. The extension downloads the dashboard to a PDF file on your computer. You can use this file to document progress or update stakeholders.
) to export the dashboard to PDF. The extension downloads the dashboard to a PDF file on your computer. You can use this file to document progress or update stakeholders.
Force Data-Collection Sync
Dashboard Essentials syncs with TOS every 24 hours. However, you can use this feature to force a data-collection sync manually with SecureTrack/SecureChange to get the most up-to-date metrics.
How Is the Data Calculated?
The Rule Cleanup dashboard uses the following TQL queries:
-
Total Cleanup: Sum of all metrics presented on the dashboard
-
Fully Shadowed Rules: fullyShadowed = true
-
Disabled Rules: disabled = true
-
Unused Rules: timeLastHit before last year
-
Empty Groups: API provided metric, no TQL
-
Duplicate Services: API provided metric, no TQL
-
Duplicate Net Objects: API provided metric, no TQL
