On This Page
Ticket Activity Dashboard
Overview
If SecureChange is configured to manage change management, you can use the Ticket Activity dashboard to track how efficiently your team is using the process. You can see this dashboard with the SecureChange license tier.
This dashboard answers the following questions:
-
How many tickets are currently open?
-
How many tickets were completed or closed over a given period?
-
How many tickets are open and sitting in each phase of the SecureChange cycle?
-
What is the average amount of time it takes to complete SecureChange tickets?
-
Which SecureChange workflow step causes the most drag on your change process?
What Can I see Here?
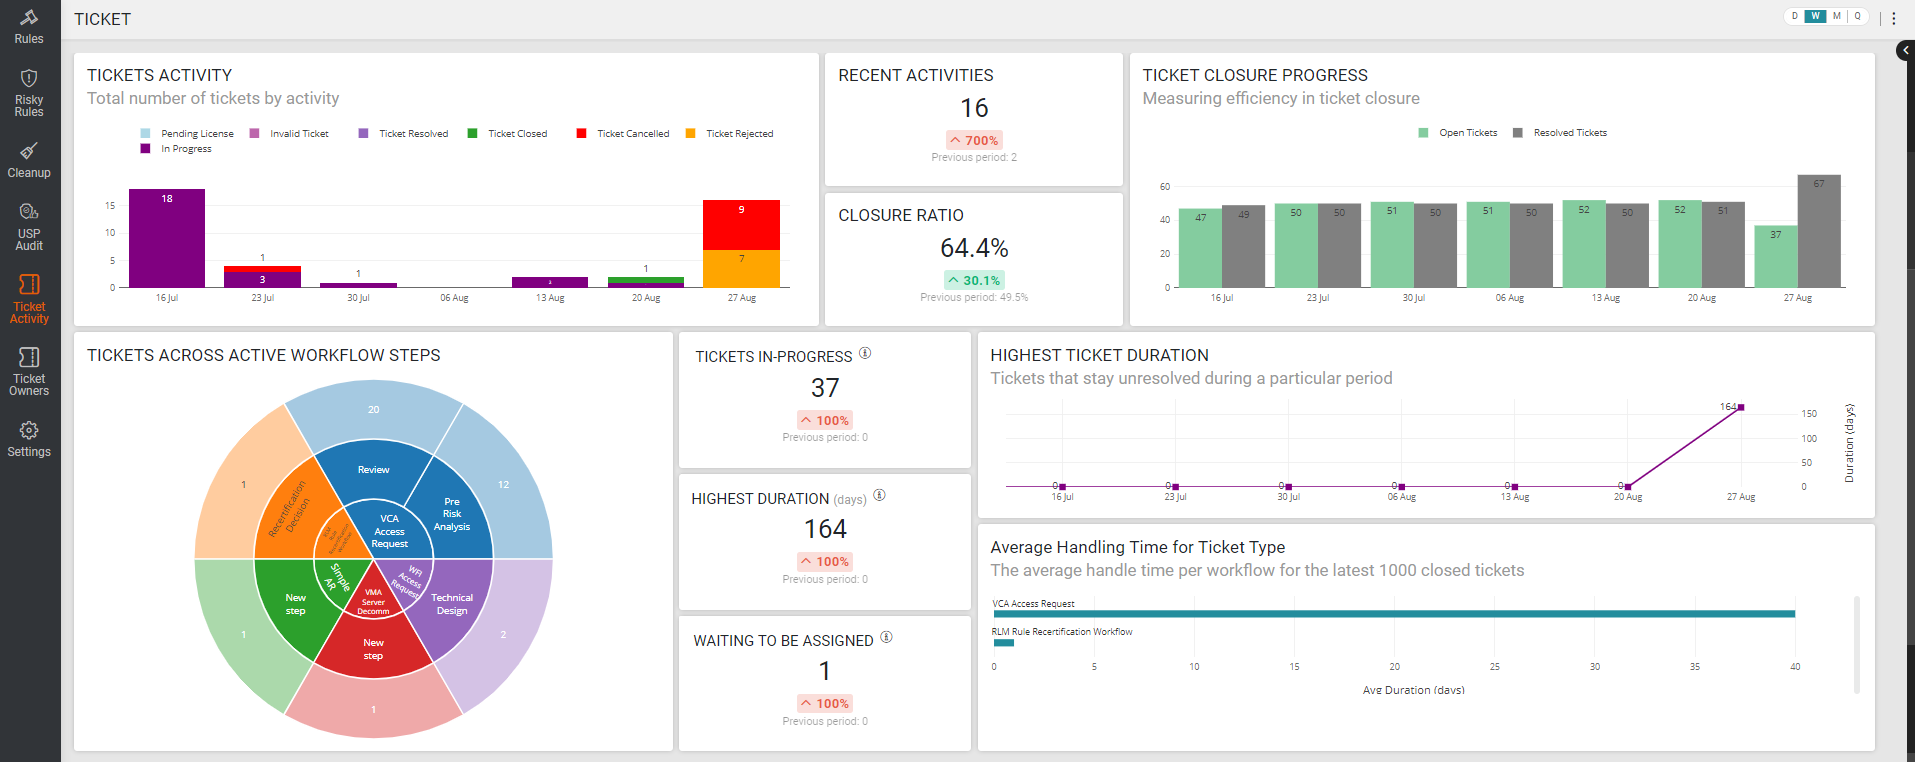
For the selected reporting period, these metrics show the following information:
-
Total Number of Tickets: Total number of tickets by status.
-
Total Tickets: Statuses of all the tickets for the selected period.
-
Resolved Ratio: Indicates the effectiveness of ticket handling by users in each time period. Resolved tickets include closed, cancelled, or rejected cases.
-
Tickets Opened vs Closed: Comparison between open and closed tickets.
-
Tickets Across Active Workflow Steps: This chart contains three layers:
-
The innermost layer represents the workflow name.
-
The middle layer represents the step name in the workflow.
-
The outermost layer represents the number of tickets for each step.
You can click any highlighted section in the chart to filter the information for that workflow type.
-
-
In-Progress: Number of tickets in progress.
-
Highest Duration: The longest duration for a single ticket.
-
Waiting to be Assigned: Number of tickets waiting to be assigned to a handler.
-
Tickets Backlog and Highest Ticket Duration: Tickets that remain unresolved during a particular period and the average time in this status.
-
Average Handling Time for Ticket Type: Average handle time by workflow for the last 1000 closed tickets.
What Can I do Here?
Use the Graphs
Slide the graph to see dates before or after the current view.
Highlight Bars
Hover on a bar in a bar graph to see the number of objects that match the corresponding color in the graph legend.
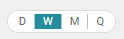
Change the Aggregation Setting
Select the setting (Day/Week/Month/Quarter) to determine the aggregation of the dashboard data.
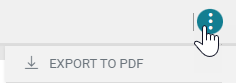
Export Dashboard
Select the Action list (![]() ) to export the dashboard to PDF. The extension downloads the dashboard to a PDF file on your computer. You can use this file to document progress or update stakeholders.
) to export the dashboard to PDF. The extension downloads the dashboard to a PDF file on your computer. You can use this file to document progress or update stakeholders.
Force Data-Collection Sync
Dashboard Essentials syncs with TOS every 24 hours. However, you can use this feature to force a data-collection sync manually with SecureTrack/SecureChange to get the most up-to-date metrics.
