On This Page
Ticket Owners Dashboard
Overview
If SecureChange is configured to manage change management, you can use the Ticket Handlers dashboard to track how efficiently stakeholders in the change process complete workflow steps. This can help you identify the root cause of lagging SecureChange tickets and identify ways to improve the process. You can see this dashboard with the SecureChange license tier.
This dashboard answers the following questions:
-
Who opens the most tickets?
-
How many tickets are assigned to each handler?
-
Which handlers are most or least efficient at completing tickets?
-
How much time, on average, do tickets require to complete?
-
Has average completion time improved over time?
What Can I see Here?
These metrics show the following information:
-
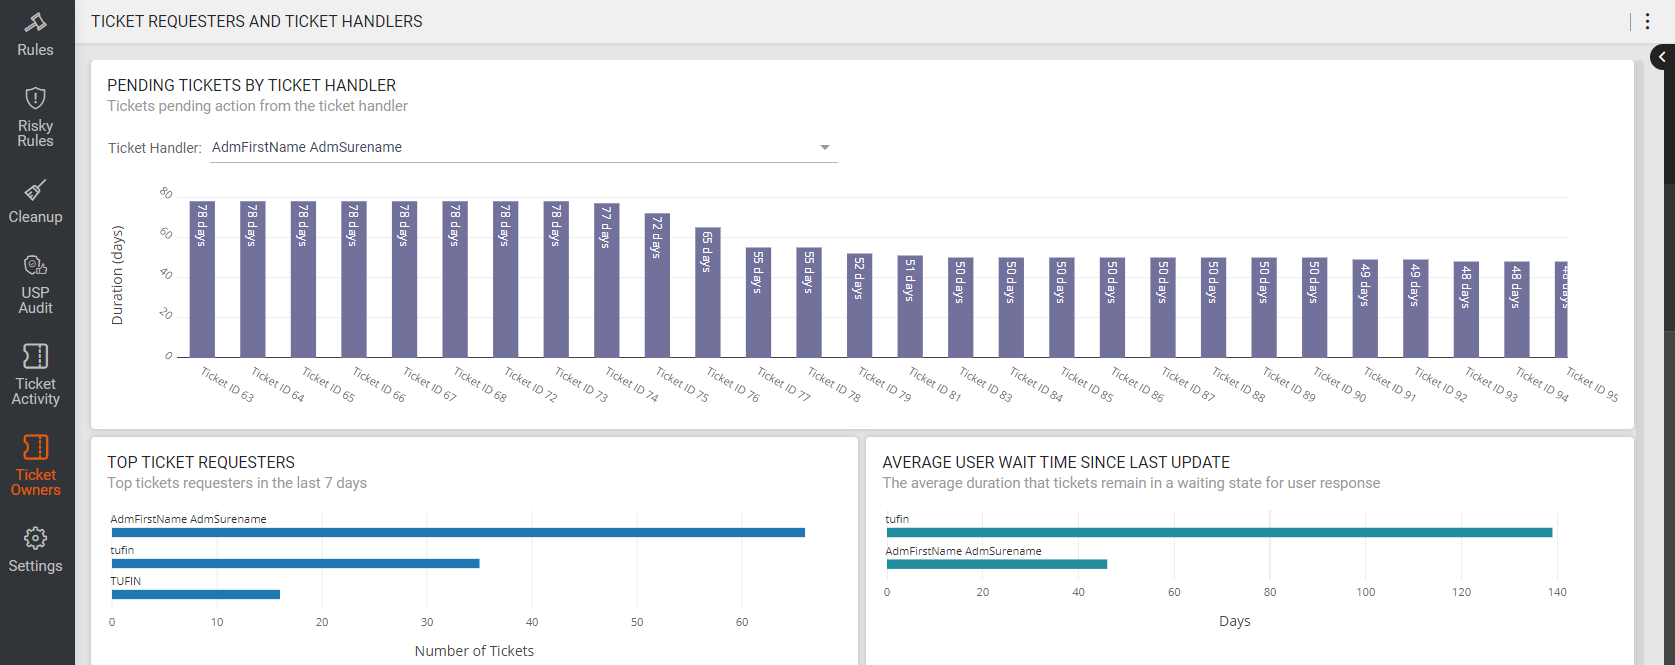
Pending Tickets by Ticket Handler: Tickets waiting for action from the ticket handler. Select a handler from the list.
-
Top Ticket Requester: Top ticket requesters in the last seven days.
-
Average User Wait Time Since Last Update: Average duration that the tickets remained in a waiting state for a user response.
What Can I do Here?
Use the Graphs
Slide the graph to see dates before or after the current view.
Highlight Bars
Hover on a bar in a bar graph to see the number of objects that match the corresponding color in the graph legend.
Change the Aggregation Setting
Select the setting (Day/Week/Month/Quarter) to determine the aggregation of the dashboard data.
Force Data-Collection Sync
Dashboard Essentials syncs with TOS every 24 hours. However, you can use this feature to force a data-collection sync manually with SecureTrack/SecureChange to get the most up-to-date metrics.
