On This Page
USP Audit Dashboard
Overview
If Unified Security Policies (USPs) have been configured in Tufin, you can use the USP Audit dashboard to track network-wide compliance with these policies. If your USPs have been configured based on specific audit requirements (for example, PCI DSS), this dashboard represents your overall network compliance with these regulations.
This dashboard answers the following questions:
-
How compliant is my network?
-
Which devices face the highest risk due to non-compliance?
-
Which policies cause the most violations and may be worth prioritizing?
-
How much of my rule base is evaluated against USPs?
What Can I see Here?
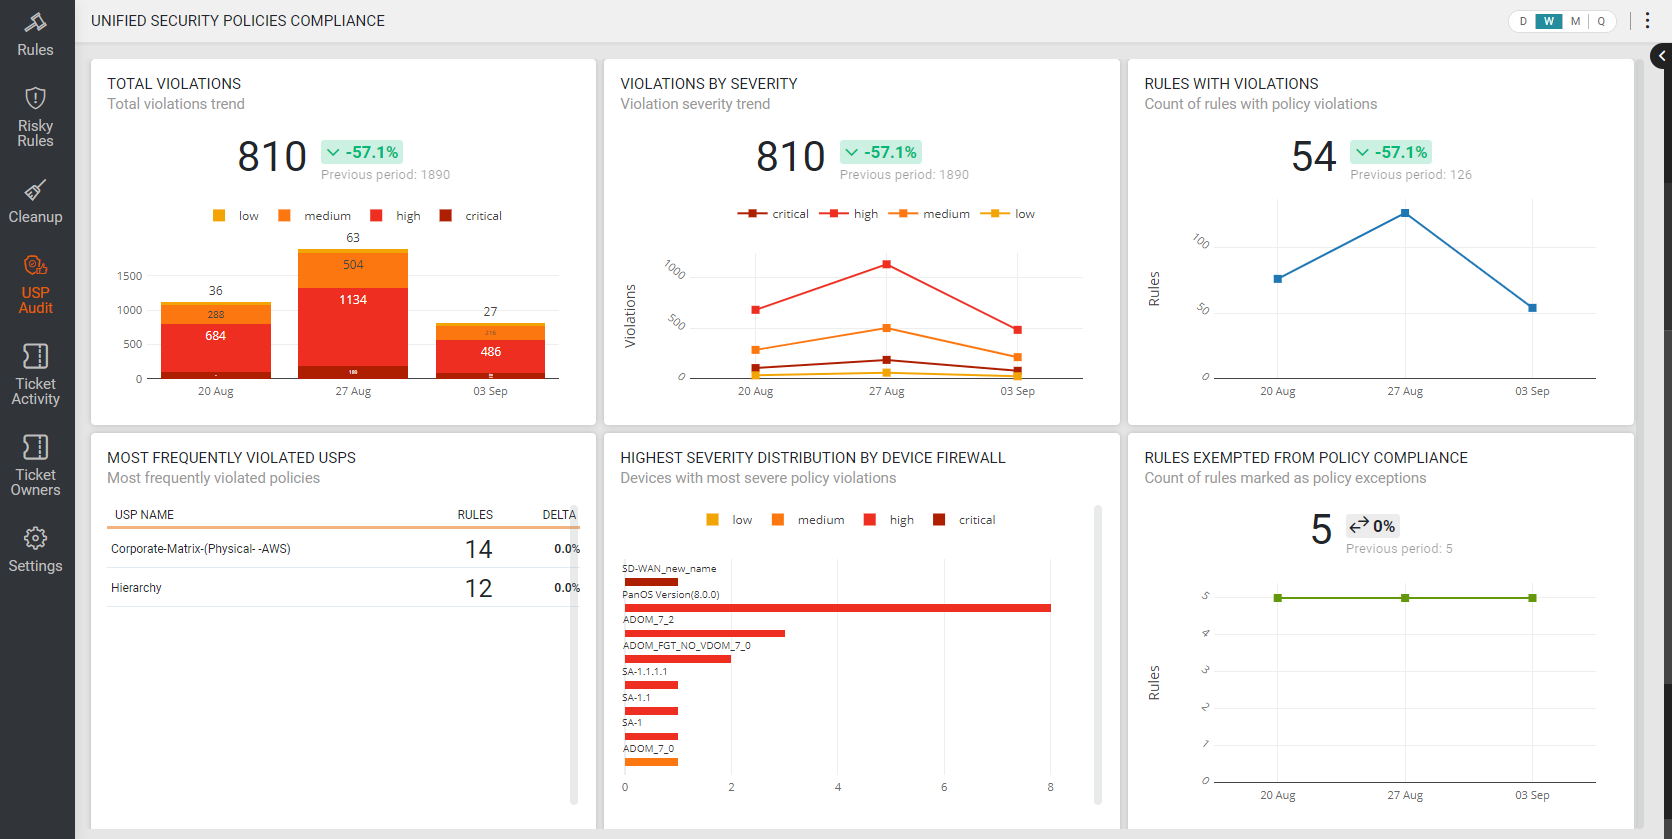
For the selected reporting period, these metrics show the following information:
-
Total Violations: Trend of total violations.
-
Violations by Severity: Trend of violations by severity.
-
Rules with Violations: Number of rules with policy violations.
-
Most Frequently-Violated USPs: List of most-frequently violated policies.
-
Highest Severity Distribution by Device Firewall: Devices with the most severe policy violations.
-
Rules Exempted from Policy Compliance: Number of rules defined as policy exceptions.
What Can I do Here?
Use the Graphs
Slide the graph to see dates before or after the current view.
Highlight Bars
Hover on a bar in a bar graph to see the number of objects that match the corresponding color in the graph legend.
Change the Aggregation Setting
Select the setting (Day/Week/Month/Quarter) to determine the aggregation of the dashboard data.
Export Dashboard
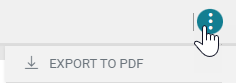
Select the Action list (![]() ) to export the dashboard to PDF. The extension downloads the dashboard to a PDF file on your computer. You can use this file to document progress or update stakeholders.
) to export the dashboard to PDF. The extension downloads the dashboard to a PDF file on your computer. You can use this file to document progress or update stakeholders.
Force Data-Collection Sync
Dashboard Essentials syncs with TOS every 24 hours. However, you can use this feature to force a data-collection sync manually with SecureTrack/SecureChange to get the most up-to-date metrics.
How Is the Data Calculated?
The USP Audit dashboard uses the following TQL queries:
-
Total Violations: violations.timeCreated exists
-
Violations Severity: violations.timeCreated exists and violationHighestSeverity = [CRITICAL, HIGH, MEDIUM, or LOW]
-
Rules with Violations: violations.timeCreated exists
