On this page
Personalize TufinAI Executive Dashboard
Overview
Populate the TufinAI Executive Dashboard with charts that surface the rule and ticket data you need, when you need it. Provide the requirements for the chart in natural language. The AI Assistant Executive Dashboard processes your input, generates the chart, and adds it to your dashboard.
Charts are available for rules and tickets:
-
Rules
Use Rules charts to visualize SecureTrack rule data. For example, get analytics about your rule base, such as rule counts, certification status, recent modifications, and service trends.
-
Tickets
Use Tickets charts to visualize SecureChange ticket data. For example, get analytics about change-management activity, such as ticket volume, status, workflow steps, handling time, and backlog trends.
See Getting started with the TufinAI Executive Dashboard.
Chart limits
The maximum number of charts you can add is as follows:
-
5.2 and earlier: 20 charts
-
5.3 and later: 40 charts
This AI feature includes a complimentary three-month trial period that begins when the feature is enabled. At the end of the trial period, the feature is disabled.
To continue or restore access, you need an AI-Assistant license. For more information, contact your account manager.
Data, privacy, and security
-
AI Assistants collect data for performance analysis and internal software improvements.
-
All sensitive data is encrypted with restricted access.
-
Customer data is not used to train or develop the AI Assistant models.
-
There is no direct connection to the cloud: the connection is established through the browser, which acts as a proxy between the Tufin Cluster and Tufin Cloud.
TufinAI Executive Dashboard
-
Simple to create
Create custom charts by describing your requirements in natural language, using the existing examples for ideas. Generate a chart preview, and then add the chart to the dashboard when it meets your needs. Export a specific chart or the entire dashboard to share data with peers or analyze data in third-party tools / external tools / another system.
-
Automatic/on-demand data refresh
Executive Dashboard data refreshes nightly after you generate custom charts. You can also refresh charts on demand to retrieve the latest available data.
-
Simple to change
Update chart specifications at any time and regenerate the chart.
-
Flexible export
Export a specific chart or the entire dashboard to share data with peers, analyze data in third-party applications, and more.
Getting started
After you configure the required authorization and complete the prerequisites, you can get started in the following ways:
-
Default charts
When you open the dashboard for the first time, a default set of charts that use live data from your system are displayed. You can customize the default charts as needed. See Default charts in executive dashboard.
-
Custom charts
Add custom charts to tailor the dashboard to your needs. See Add custom charts.
-
Chart examples
Review our chart examples for ideas. See Natural language prompt examples for charts.
User authorization for executive dashboards
SecureTrack and SecureChange users with the required roles are authorized to view, create, and manage executive dashboards.
User roles for executive dashboards
Authenticated users with either of the following roles are authorized to view and edit executive dashboards:
-
SecureTrack super-admin users
-
SecureChange users whose roles include View Reports tab and create reports permission
Authorize non-super-admin SecureTrack users for executive dashboards
To allow non-super-admin users in SecureTrack to view and edit executive dashboards, explicitly authorize them by using SecureChange's RBAC mechanism for that user.
-
Go to SecureChange > Users.
-
Do one of the following:
-
Import the user from the relevant LDAP repository.
-
Create a local user with the same login name as the SecureTrack user's login name.
-
-
Assign that user a role that includes the View Reports tab and create reports permission.
For more information, see User authentication.
Prerequisites
-
Cloud access from browser to
https://ai-powered-dashboard.tufin.com/chart-translationhvia HTTPS (TCP 443) -
TufinAI Executive Dashboard enabled by a super admin
-
TufinAI SKU
Default charts in executive dashboard
When you open the TufinAI Executive Dashboard for the first time, selecting Click here displays a set of default charts.
The charts use live data from your system, providing relevant information from the first time you open the dashboard. The default set of charts includes charts for rules and, if you have SecureChange permissions, also charts for tickets.
You can modify the specifications of existing charts to meet your requirements or delete charts that you do not need.
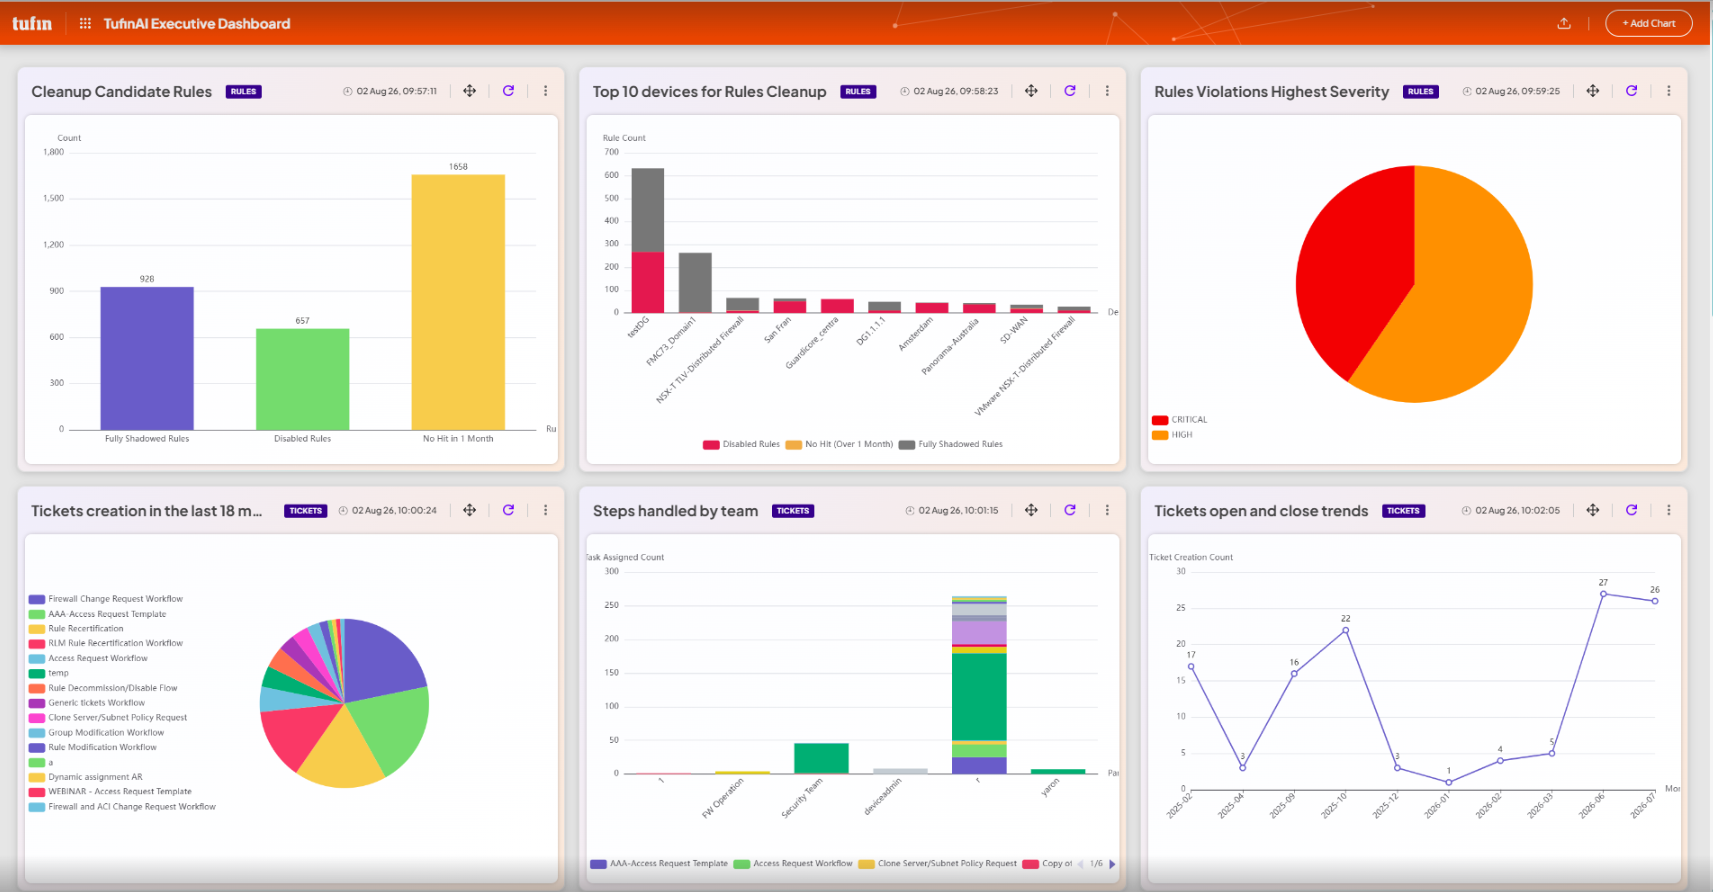
The table below shows the default charts you can view in the executive dashboard.
|
Category |
Default chart |
|---|---|
|
Rules |
|
|
Tickets |
|
Add custom charts
Generate custom charts according to your specifications.
When you open the TufinAI Executive Dashboard for the first time, you see examples of prebuilt charts.
-
Go to SecureTrack > Dashboard > TufinAI Executive Dashboard.
-
Click Add chart.
-
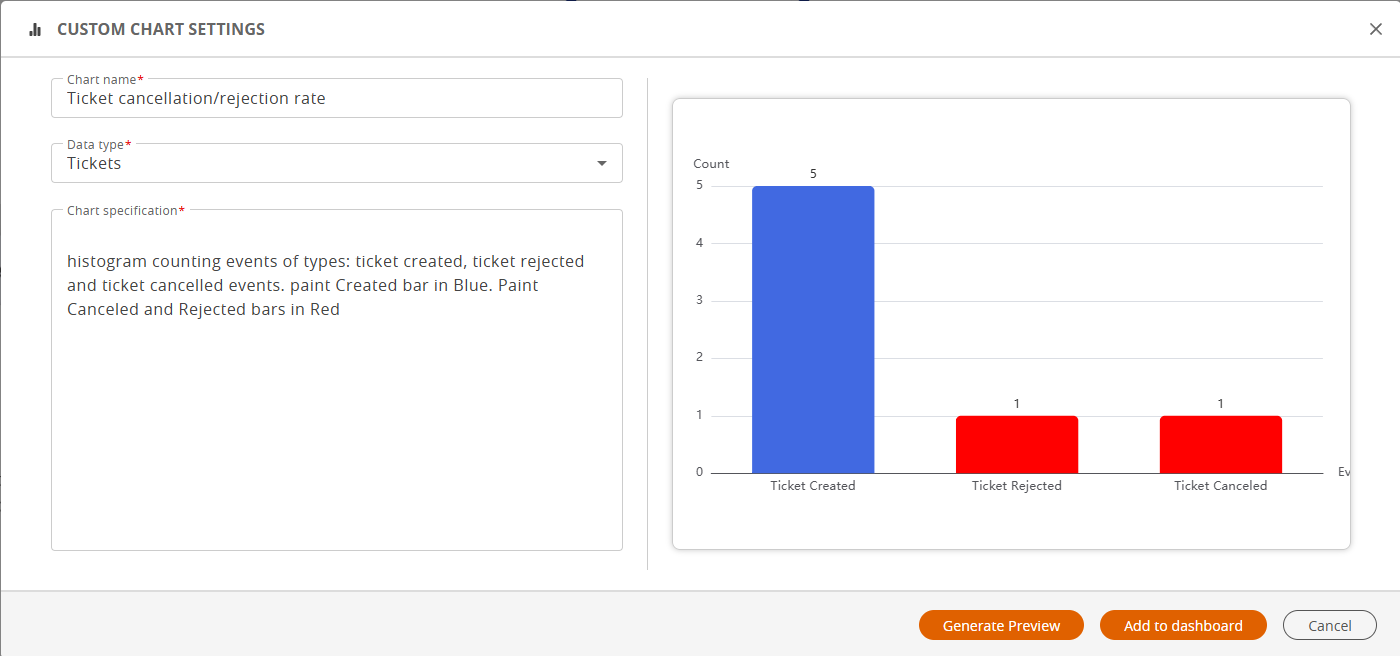
In Custom Chart Settings, do the following:
-
Enter the Chart name.
-
Select the Data type for the chart as Rules or Tickets.
-
Paste a prompt, or type the chart's specifications in natural language. See Natural language prompt examples for charts.
-
-
Click Generate Preview.
-
To add the generated chart to the Executive Dashboard, click Add to dashboard.
If SSO is disabled, the logged-in user must be configured in both applications with the same login name and the required permissions. Otherwise, the Executive Dashboard is available only in SecureTrack.
Managing custom charts
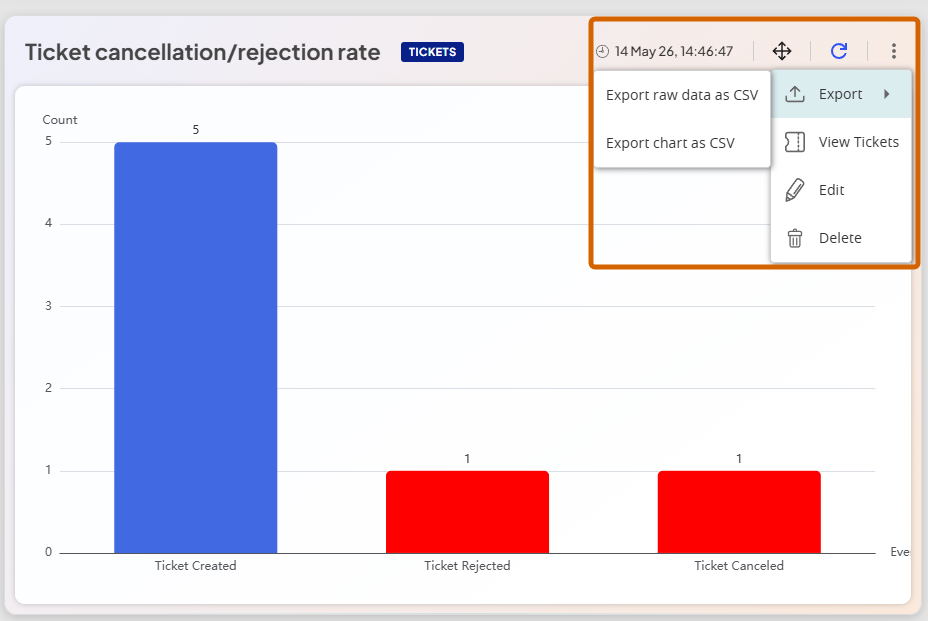
After creating a custom chart, you can use the available chart options to manage it. Most options are available from the chart's Actions menu or toolbar.
|
Option |
Description |
|---|---|
|
|
Updates the chart with the latest available data on-demand. By default, the system refreshes dashboard data nightly. The timestamp shows when chart data was recently updated. |
|
|
Rearranges charts to customize your dashboard view. |
|
|
Exports dashboard or chart data. Available options include:
|
|
View Rules/Tickets |
Takes you to the relevant page in SecureTrack or SecureChange depending on the chart's data type:
|
|
Edit |
Modifies chart specifications. |
| Delete |
Permanently deletes the chart. |
 Refresh
 Move
Move Export
Natural language prompt examples for charts
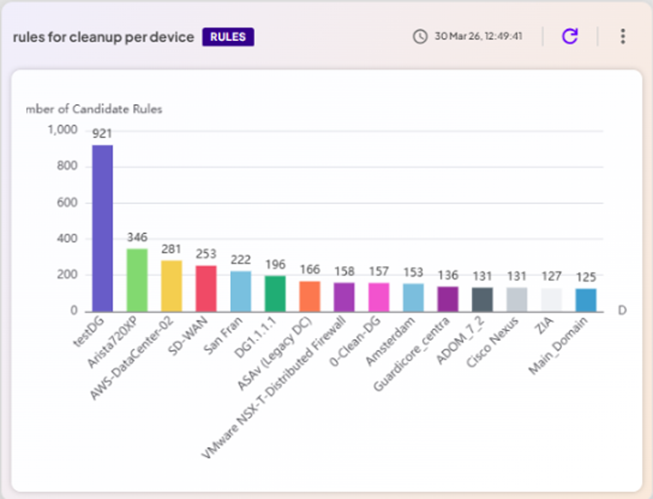
Here are a few example natural language prompts to generate custom charts for rules and tickets in the TufinAI Executive Dashboard.
Rule chart examples
|
To generate this rule chart |
Use this natural language prompt |
Example result |
|---|---|---|
|
Rules: Candidates for Cleanup per Device |
Candidate rules for cleanup fit at least one of the following criteria: rules which didn't get a hit over a year, disabled rules which weren't modified over a month, fully shadowed rules. |
|
|
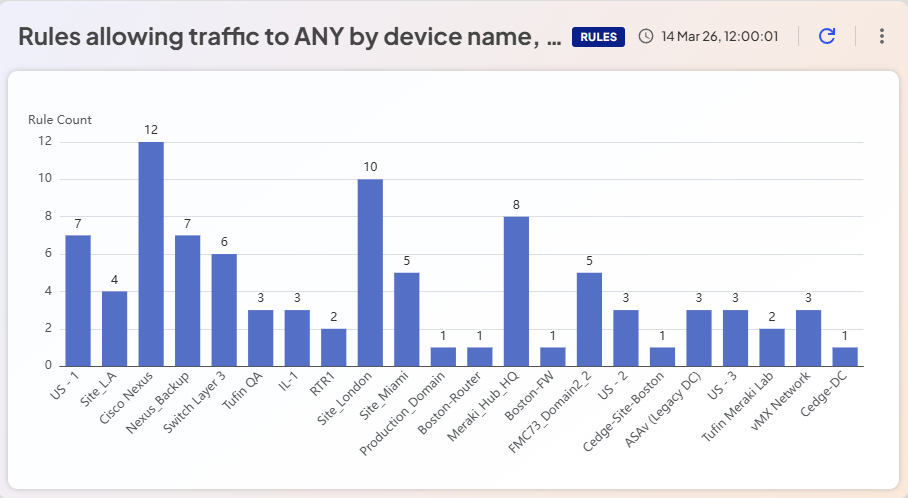
Rules: Allow traffic to ANY by Device Name/Vendor |
bar chart counting rules whose destination ip is ANY by policy device name. show only rules of vendor Cisco |
|
|
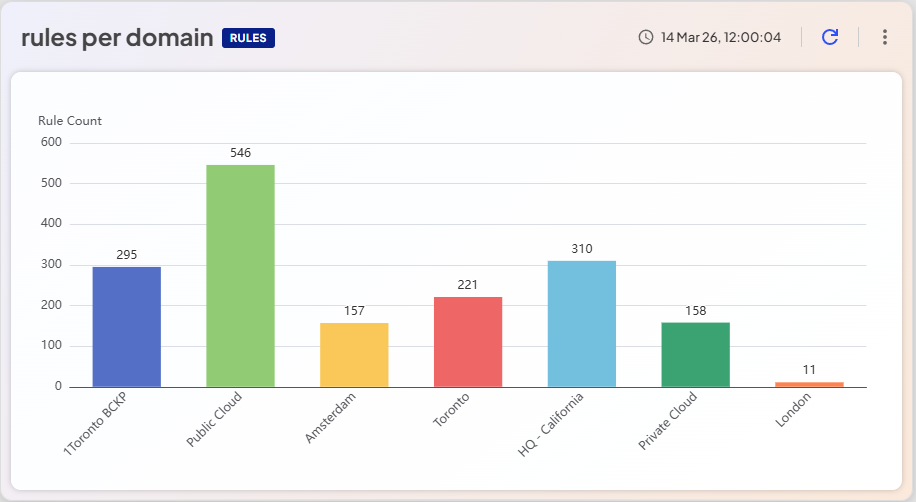
Rules: Per Domain |
draw a histogram counting rules per device's domain, excluding 'default' domain. paint each bar differently. show the count per bar on a label |
|
|
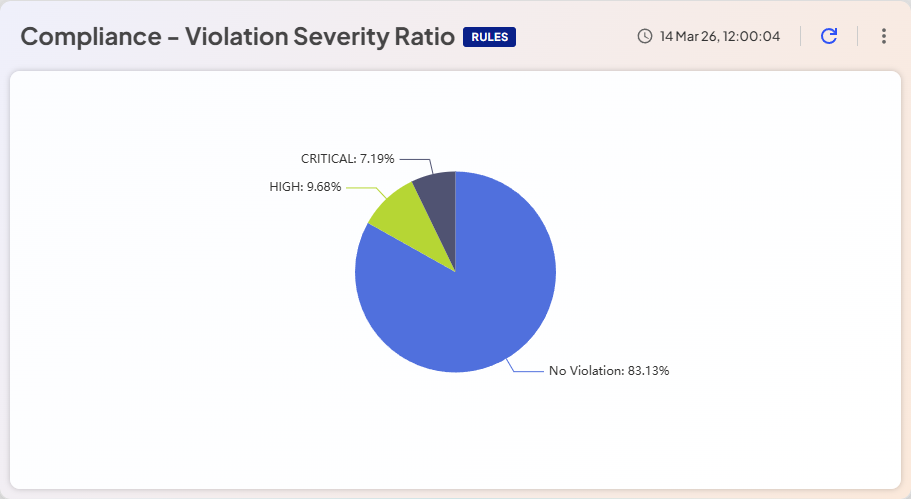
Rules: Compliance Violation Severity Ratio |
Pie chart counting rules per highest violation severity. rules without value of highest violation severity shall be counted by 'No Violation' slice |
|
|
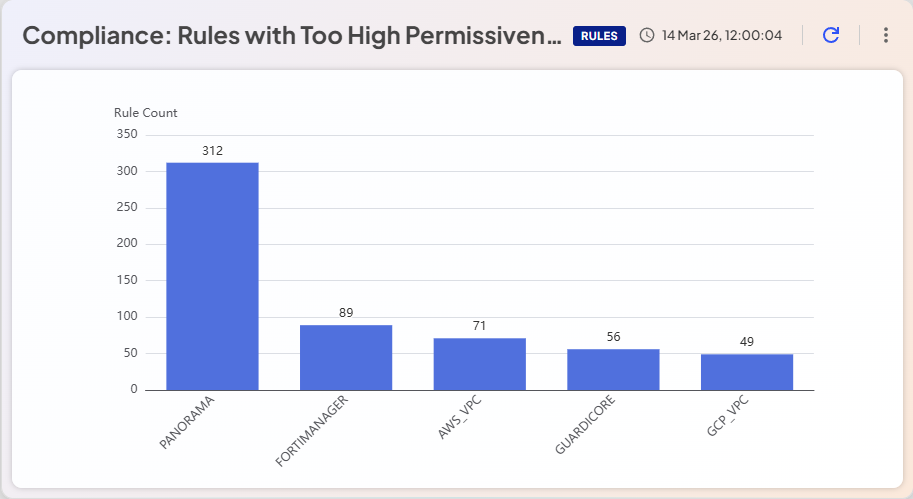
Compliance: Rules with Too High Permissiveness Levels |
bar counting rules of 'HIGH' permissiveness level per device model. show only top 5 models. color each bar differently |
|
|
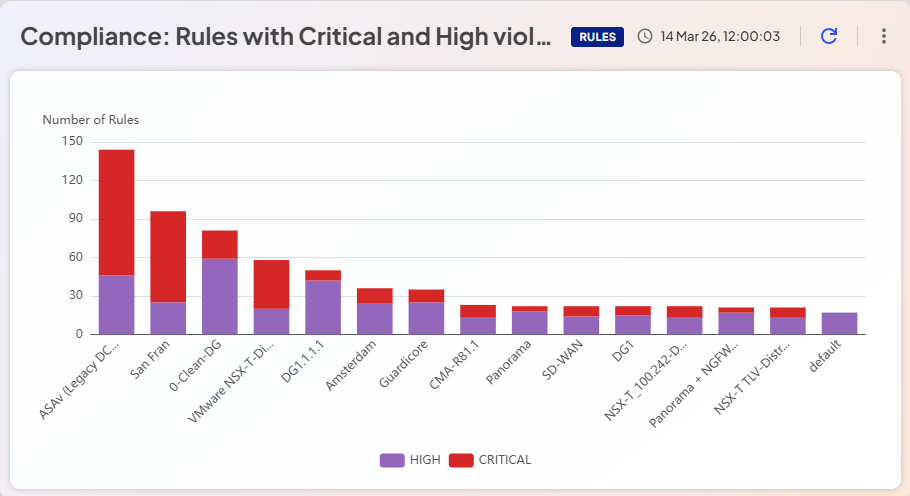
Compliance: Rules with Critical and High Violation Severity |
stacked bar chart counting rules with 'HIGH' and 'CRITICAL' highest violation severity per policy device name. show only top 15 devices. Truncate device names after 15 characters. avoid legend from overlapping the chart |
|
Ticket chart examples
|
To generate this ticket chart |
Use this natural language prompt |
Example result |
|---|---|---|
|
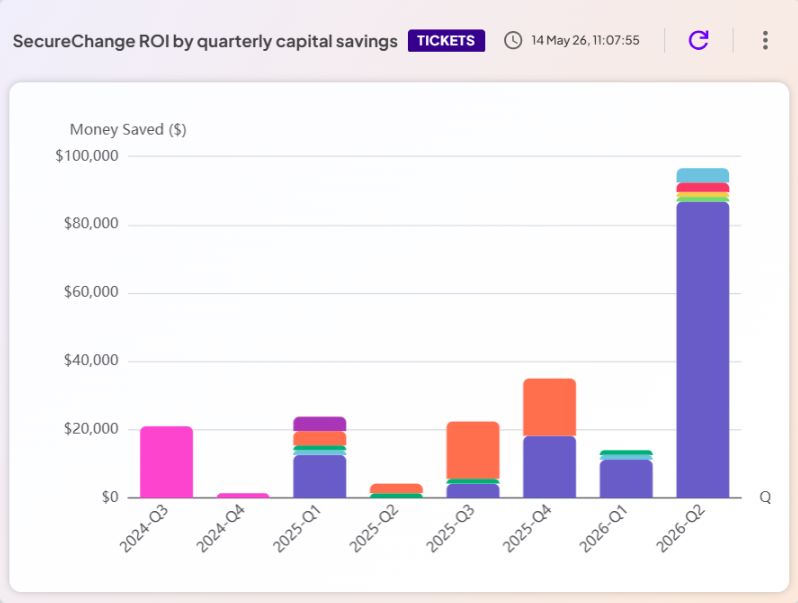
Tickets: SecureChange ROI by Quarterly $ Savings |
I want to show the amount of money saved each quarter during the last 24 months. this should be a quarterly bar showing per quarter the amount of money saved per ticket For each ticket that was opened during that quarter 1400 $ Saved. make it stacked bar per Workflow type. show quarters with 0 |
|
|
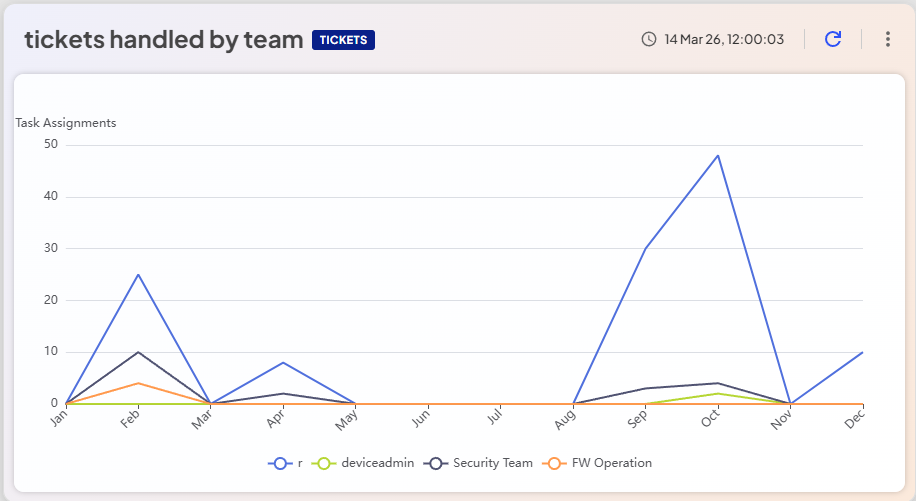
Tickets: Handled by Team |
line chart counting task assignment events every month during year 2025. add label per month. line shall not be curved. draw a line per participant name. present a legend at the bottom of the chart. avoid the legend from overlapping the chart |
|
|
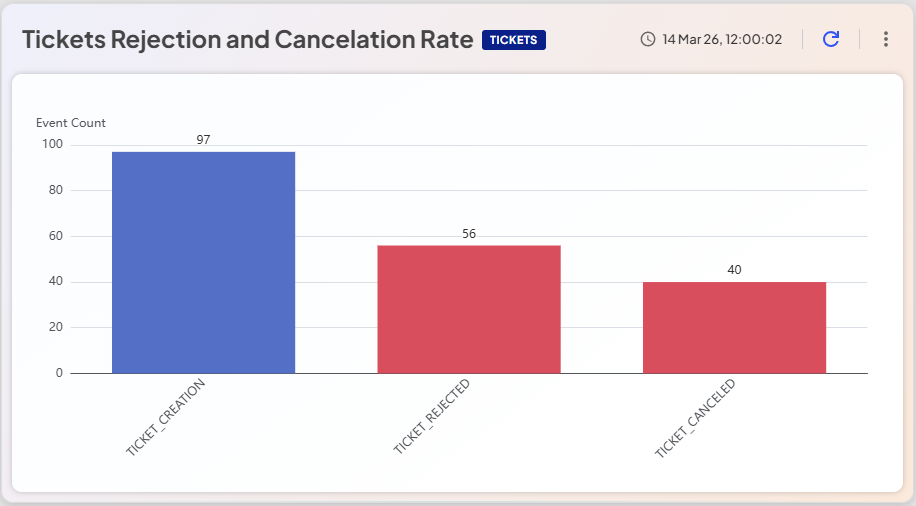
Tickets: Rejection and Cancellation Rate |
histogram counting events of types: ticket created, ticket rejected and ticket cancelled events. paint Created bar in Blue. Paint Canceled and Rejected bars in Red |
|
|
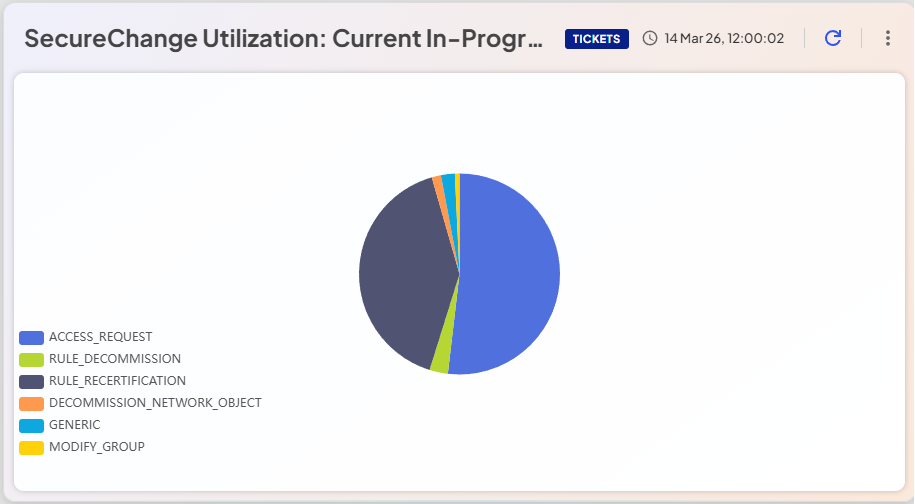
Tickets: SecureChange Utilization: Current In-Progress Tickets per Workflow Type |
show a pie chart showing currently opened tickets per workflow type. show label per slice. Ignore events without workflow type. don't present label per slice. show legend |
|
|
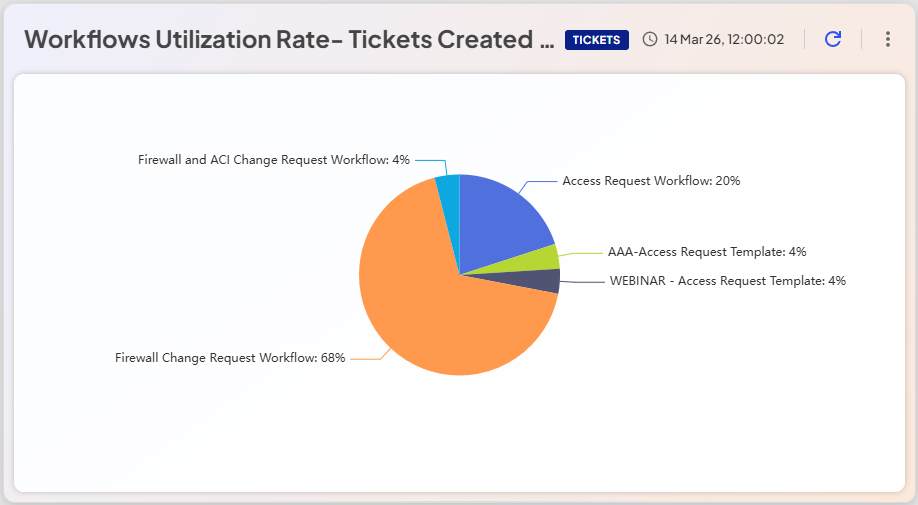
Tickets: Workflows Utilization Rate- Tickets Created on 2025 per Workflow |
pie chart counting tickets created during year 2025 per workflow name. consider only workflows type of ACCESS REQUEST. don't present legend |
|
|
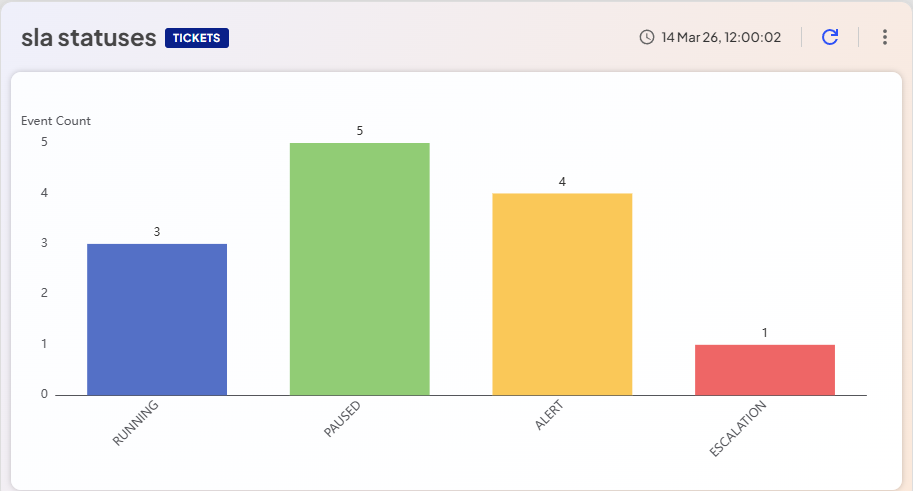
Tickets: SLA Statuses |
histogram showing count of sla status update events per sla status. don't consider NA. paint each bar in differently |
|
|
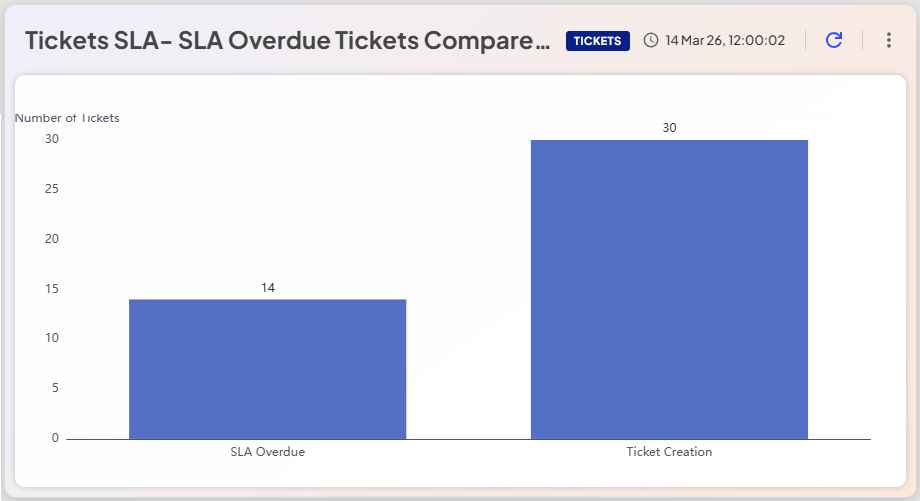
Tickets: SLA Overdue Tickets Compared to Total Tickets Created |
bar chart counting how many tickets SLA status was overdue and how many tickets were created, for Access Request workflow type. don't present legend |
|
|
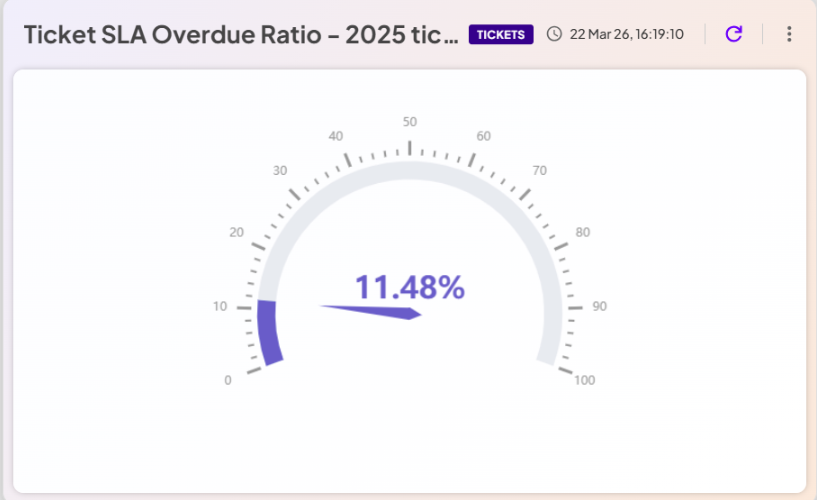
Tickets: SLA Overdue Ratio |
gauge showing the percentage of SLA overdue events among the tickets opened during year 2025 |
|
|
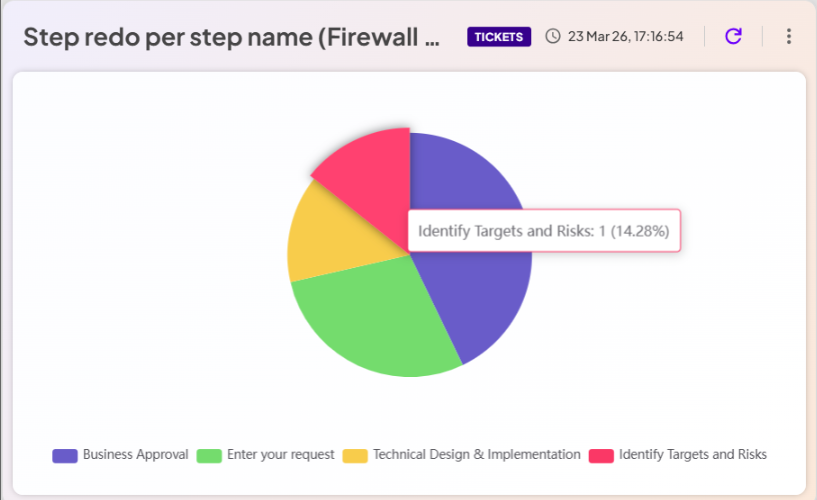
Tickets: Step redo per step name (Firewall Change Request Workflow) |
pie chart counting step redo events per step name |
|
Related topics
Was this helpful?
Thank you!
We’d love your feedback
We really appreciate your feedback
Send this page to a colleague