On this page
Segmentation Intelligence
Overview
Available from 5.3.00, segmentation intelligence is an optional paid TOS feature that analyzes your security zones and subnet definitions in the zone manager and presents the results in a visual and informative way. It pinpoints zone configuration caveats and deviations from common best practices and provides insights and recommendations for resolution. It provides key insights and recommendations which appear even when there are no issues for that category.
You must have zones defined with subnets.
The term object or network object is used in several different places and can refer to a host, subnet, or an IP address within a security rule.
What gets analyzed?
The network object analysis is performed only on:
-
Devices in The Default Domain
-
On-prem devices which are not OPM devices
-
IPv4 addresses within security rules
Recommended best practice
-
Review the segmentation intelligence graphical dashboard for a high level picture of your zone distribution. This contains sections:
-
Executive summary
-
Network coverage breakdown
-
Subnet overlap across zones
-
Network balancing
-
Subnet prefix distribution
-
-
Download the csv files that contain the data behind the graphs, to identify definitions that might need attention. See Data for a more detailed explanation of how these files can help you identify issues.
General functions
Three buttons appear at the top of the page:
-
Configuration - see Configuration.
-
Download - download the graphs and supporting data to your PC - see Data.
-
Refresh - rebuild the data and display the updated results.
Executive summary
The executive summary consists of five widgets each containing:
-
a graph of the percentage of affected zones
-
the number of affected zones compared to the total number of zones
-
severity based on the relative number of issues
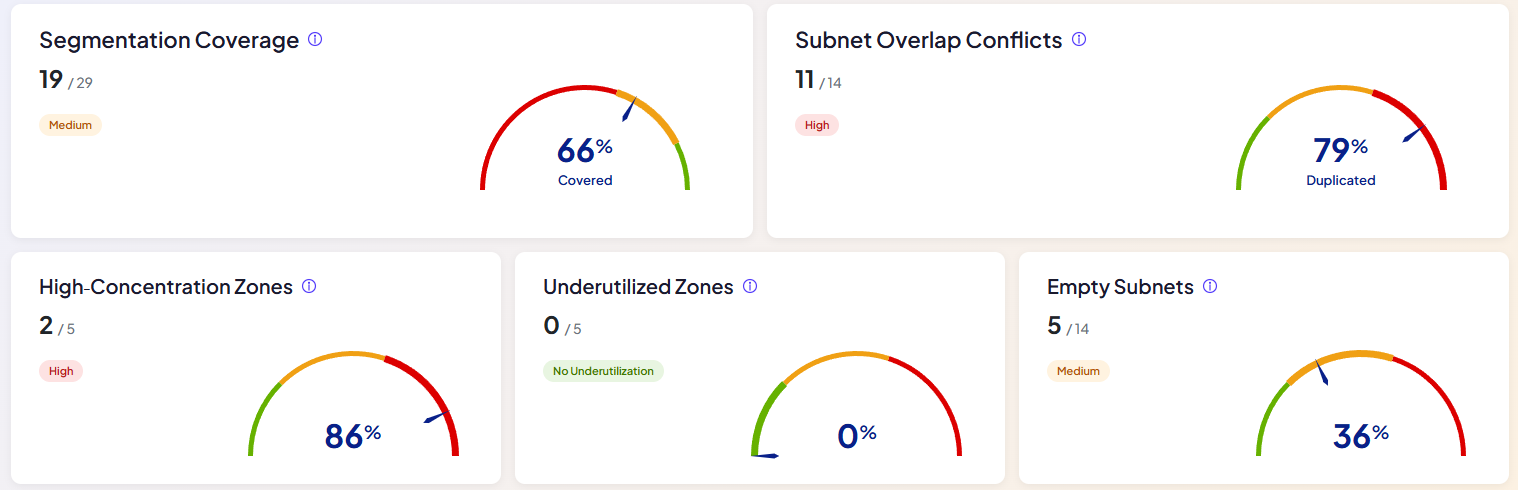
The executive summary widgets are:
Segmentation coverage: Network objects covered by exactly one zone.
Subnet overlap conflicts: Subnets from one zone containing IPs defined in another zone.
High concentration zones: Zones containing more than 25% of all network objects. Cloud and OPM devices are not currently included in the widget.
Underutilized zones: Zones containing less than 1% of all monitored subnets. Cloud and OPM devices are not currently included in the widget.
Empty subnets: Subnets with no network objects identified in TOS.
Network coverage breakdown
This graph shows how network objects are included in your defined network zones, by percentage. There are three types:
Associated: Network objects that are included in a defined zone.
Multizone: Network objects that are included in more than one defined zone.
Unassociated: Network objects that don't appear in any defined zone.
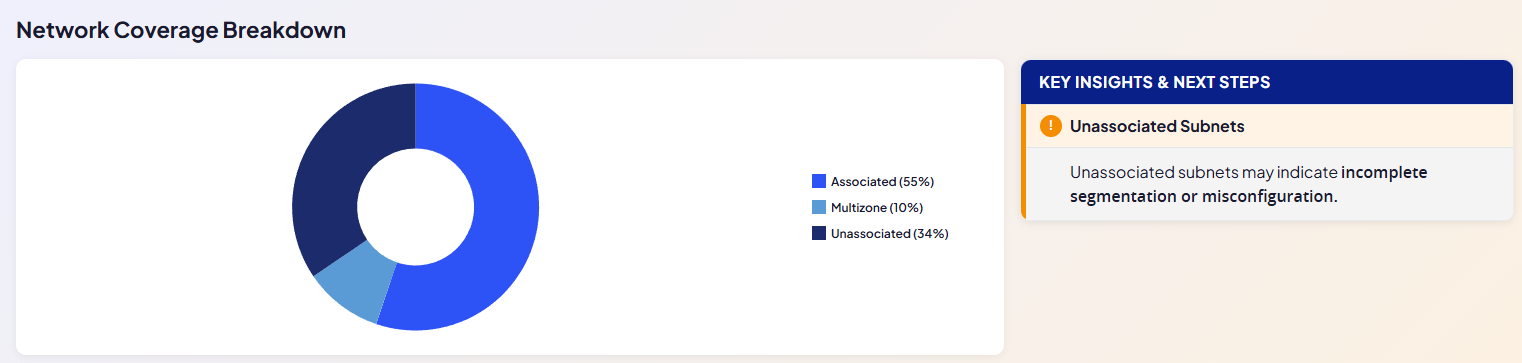
The data behind this graph can be found in the downloaded files objects_set_up_report.csv and zone_setup.csv - see Data.
Subnet overlaps across zones
The first graph shows the percentage of subnets that overlap subnets from other zones. There are two types:
Equal: The percentage of subnets in one zone that are identical to a subnet in another.
Contained: The percentage of subnets that are fully or partly contained in subnets of other zones.
Intersecting: The percentage of subnets that overlap others.
The second graph is a zone matrix of with color-coded number of overlapping subnets. Hovering over the graph shows the number of overlapping subnets between the two zones.
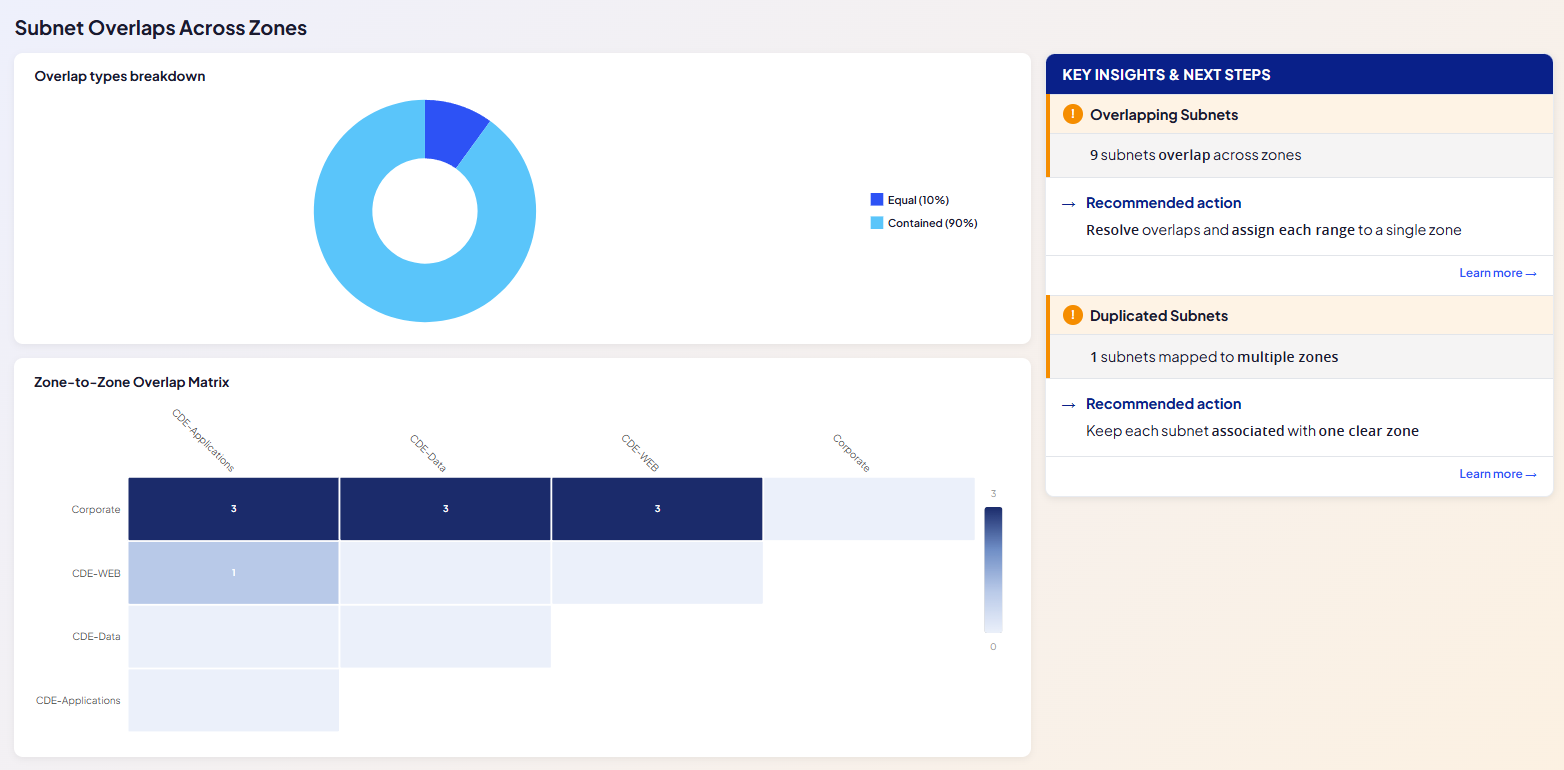
The data behind this graph can be found in the downloaded files subnet_relations.csv and zones_hierarchy.csv - see Data.
Network balancing
The first graph - zone distribution by subnet - categorizes zones by the number and size (CIDR) of their associated subnets. The second graph - zone distribution by network coverage - shows for each zone the number of network objects that are covered by it's subnets. The numbers are further broken down into subnets that are associated with a single zone and those associated with multiple zones.
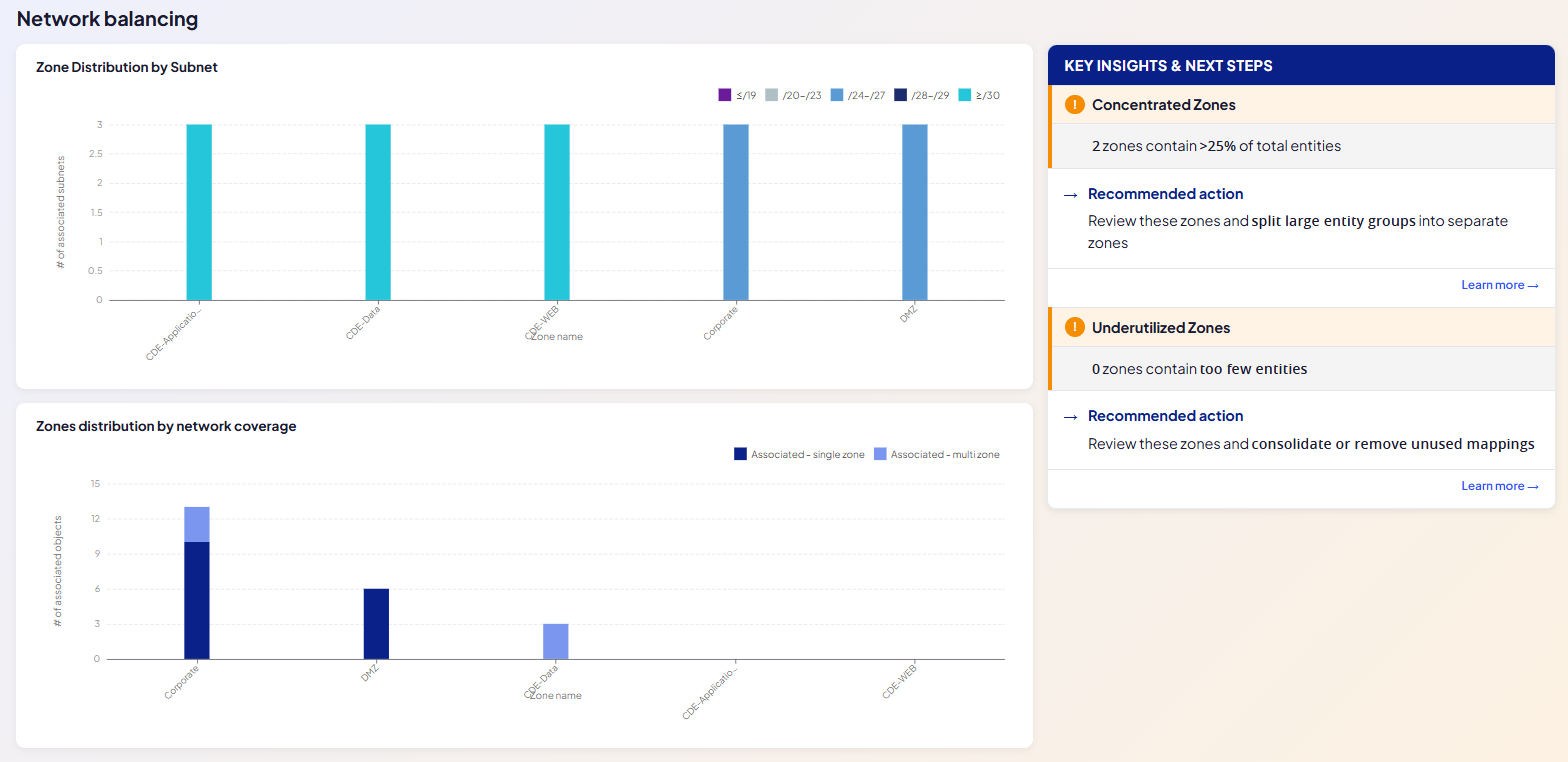
Subnet prefix distribution
The purpose of the subnet prefix distribution graph is to give you insight into the sizes you have defined for your subnets. It shows the number of subnets defined for each range of CIDR and recommends as a best practice to avoid very large subnets.
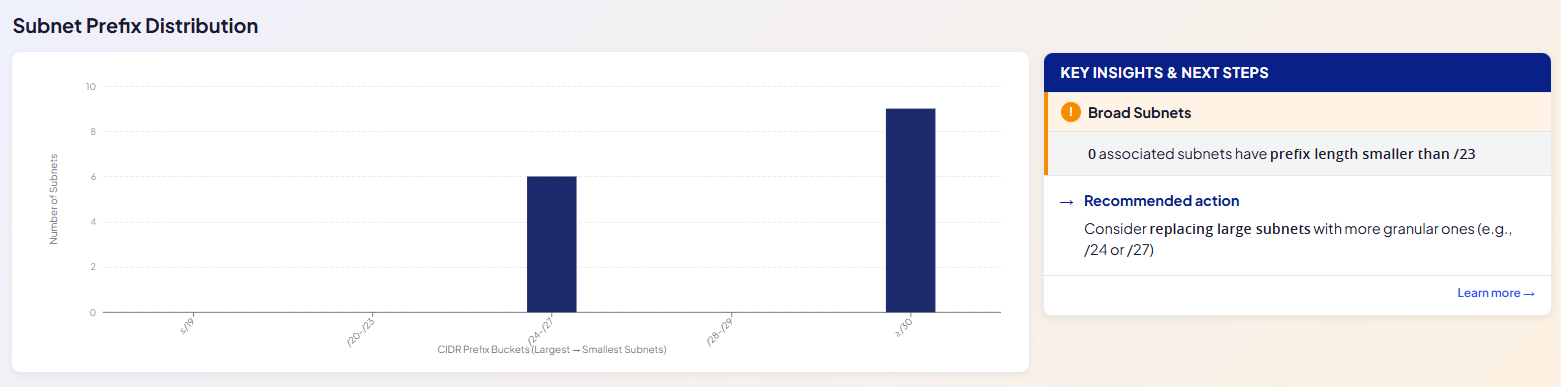
The data behind this graph can be found in the downloaded file zone_prefix_summary.csv - see Data.
Configuration
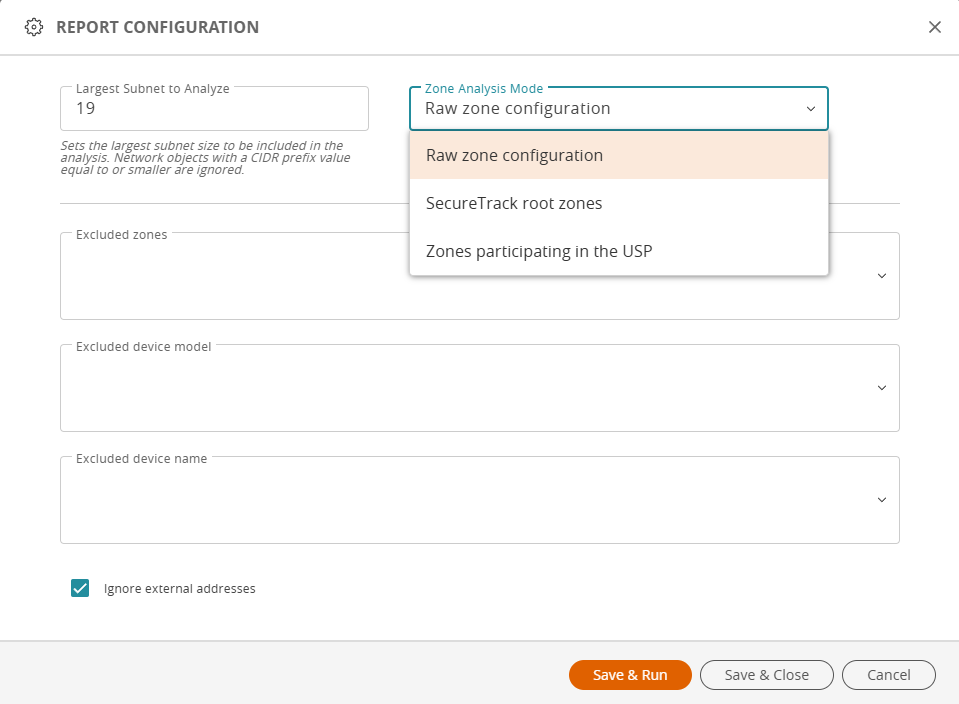
Click on the configuration icon at the top of the page.
Enter the fields as needed and save.
| Field | Description |
|---|---|
| Largest subnet to analyze | The CIDR prefix that defines the largest network object scale to analyze. Larger subnets found on your policies will be ignored. |
| Zone analysis mode |
Options:
|
| Excluded zones | Enter the names of any zones to ignore in the analysis or click and select from the list. |
| Excluded device models | Start typing and select from the list any device models whose network objects you want to exclude from the analysis. |
| Excluded device names | Start typing and select from the list any monitored devices whose network objects you want to exclude from the analysis. |
| Ignore external addresses |
Check the checkbox to exclude all IP addresses that fall outside the private address ranges defined by RFC 1918 - 10.0.0.0/8, 172.16.0.0/12 and 192.168.0.0/16. |
Data
When clicking on Download, the following files are downloaded as a single zip archive. The file names might vary slightly.
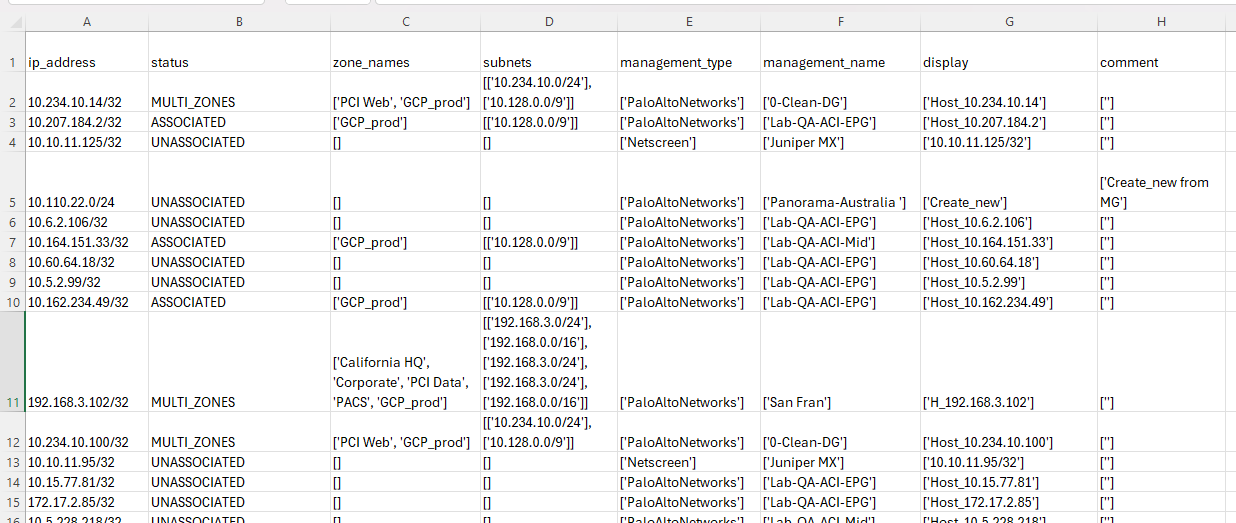
File objects_set_up_report.csv
Contains the list of network objects used in the analysis. All network objects with the same IP address are aggregated into a single row, regardless of device and vendor.
|
Column |
Description |
|---|---|
|
ip_address |
The object's IP address, in IP/CIDR format. |
| status | Associated, Multizone or Unassociated as described above. |
| zone_names | All zones in which the object is fully contained. |
| subnets | All subnets in which the object is fully contained. |
| management_type | One or more vendors with a device that has a network object defining this IP address. |
| management_name | Name specified in TOS of one or more devices that have a network object defining this IP address. |
|
display |
One or more names of network objects defining this IP address, as retrieved by TOS from the device(s). |
|
comment |
One or more comments of network objects defining this IP address, as retrieved by TOS from the device(s). |
Example
Recommended best practices
-
Use this data to help you understand which objects are clearly associated with a single zone, which are not associated with any zone, and which are multizone and therefore deviate from best-practice guidelines to associate objects with a single zone.
-
Make sure that every network object is fully contained in one subnet only.
File subnet_relations.csv
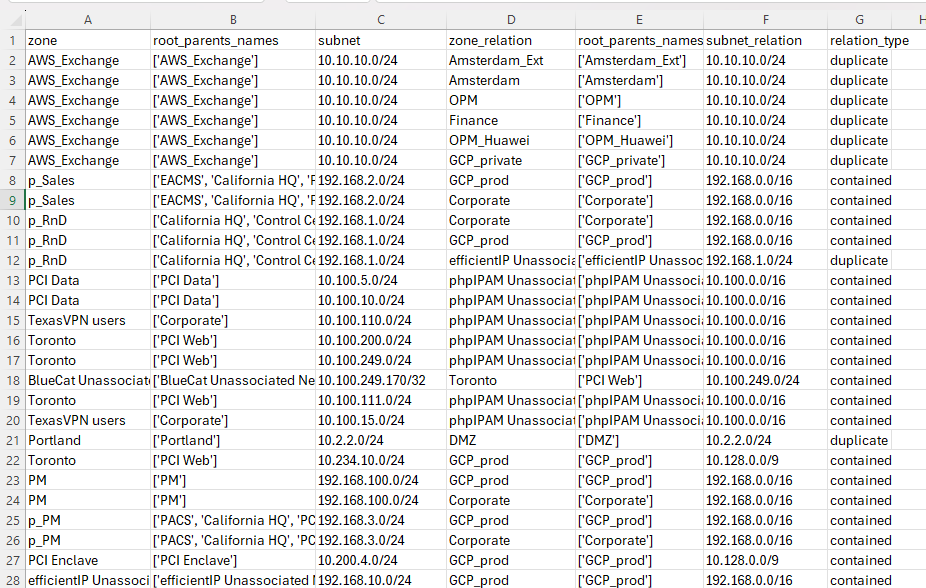
Contains the list of overlapping subnets i.e. subnet pairs each associated with a different zone that contain one or more of the same IPs.
|
Column |
Description |
|---|---|
|
zone |
The name of a zone in which all or part of the subnet appears (zone A). |
| subnet | The subnet IP address in IP/CIDR format (subnet A). |
| zone_relation | The name of another zone in which all or part of the subnet appears (zone B). |
| subnet_relation | The other subnet IP address in IP/CIDR format (subnet B). |
| relation_type | The relationship between the two subnets = equal or contained. |
Example
Recommended best practices
-
Use this data to help you identify overlapping ranges, duplicate subnet ownership, and whether the overlap is related to a parent-child hierarchy.
-
Make sure subnet definitions don't overlap i.e. don't contain IP addresses defined in any other subnets.
-
If you do have overlapping subnets, make sure they are all defined for the same zone.
File zones_hierarchy.csv
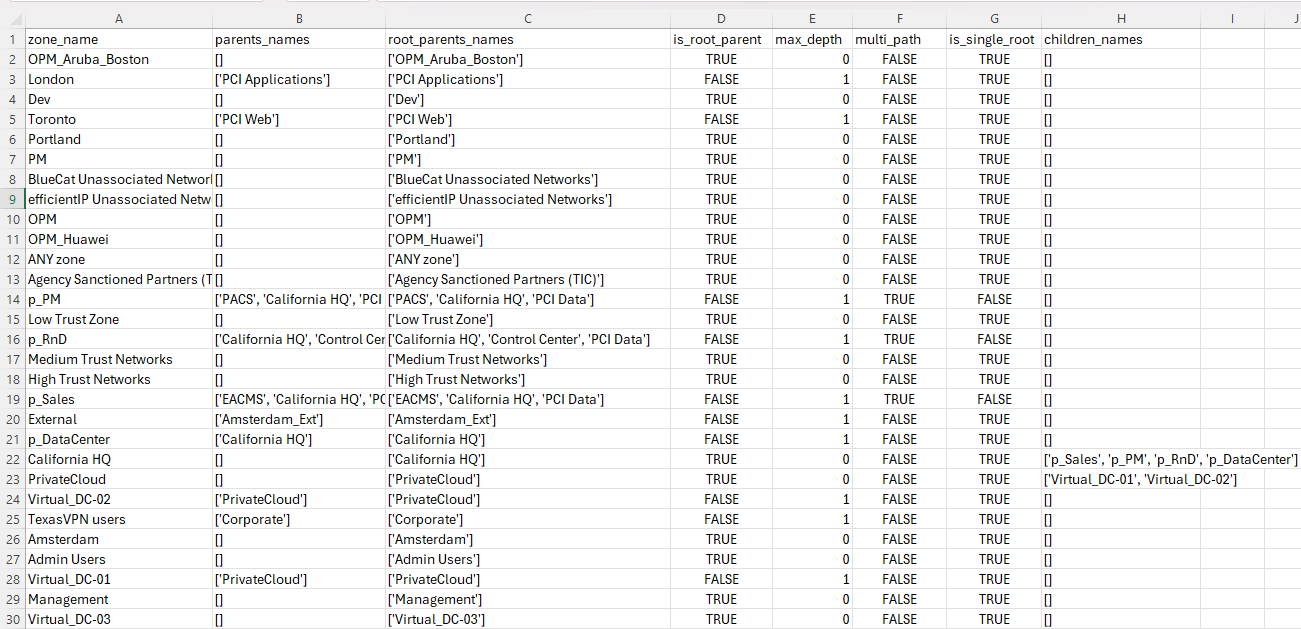
Maps zone hierarchy by listing all defined zones, showing parent, root, and child zones.
|
Column |
Description |
|---|---|
|
zone_name |
Zone name. |
| parents_names | All the zones higher up in the hierarchy up to the root zone. |
| root_parents_names | Empty or containing one or more immediate parent zones. A zone can be defined in any number of hierarchy branches.. |
| is_root_parent | TRUE when the zone is a root zone i.e. has no parent zones and does have child zones. Otherwise FALSE. |
| max_depth |
A number representing the level of this zone in the zone hierarchy i.e. distance from the root zone. |
|
multi_path |
TRUE when the zone has more than one parent zone. |
|
is_single_root |
TRUE when there is only one root zone for this zone. Otherwise FALSE. |
|
children_names |
A list of all direct child zones. |
Example
Recommended best practices
-
Use this data to help you identify overlapping ranges, duplicate subnet ownership, and whether the overlap is related to a parent-child hierarchy.
-
Make sure subnet definitions don't overlap i.e. don't contain IP addresses defined in any other subnets.
-
If you do have overlapping subnets, make sure they are all defined for the same zone.
File zone_setup.csv
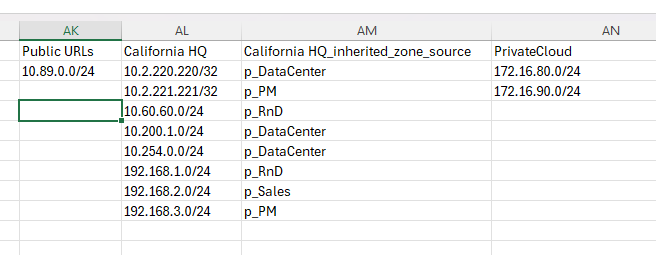
Lists every zone that has subnets defined, at the top of a separate column, and beneath it, all subnets defined for it either directly or indirectly from the zone hierarchy. For zones that have other zones beneath them in the hierarchy, the parent zone appears in an adjacent column with the suffix _inherited_zone_source and beneath it, its child zones, where every subnet is adjacent to the zone it is associated with.
Example
Recommended best practices
Use this data to help you understand:
-
Which objects are clearly associated with a single zone, which are not associated with any zone, and which are multizone and therefore treated as unassociated in coverage-related logic.
-
How objects and subnets are spread across zones and identify root zones that are overly large or too small to be meaningful.
File zone_distribution_by_entities.csv
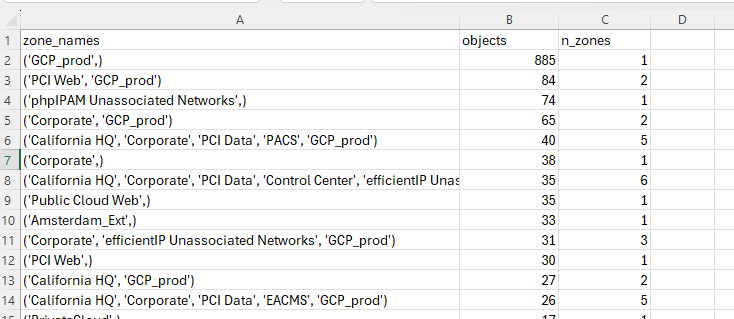
Lists the zones in which the same unique group of objects exists. Each row represents a unique group of objects together with the names of one or more zones that contain that group.
|
Column |
Description |
|---|---|
|
zone_names |
The name of one or more zones, separated by commas, in which the same group of objects exists. |
| objects | The number of objects in the group. |
| n_zones | The number of zones appearing in the column zone_names cell. |
Example
Recommended best practices
Use this data to help you understand how objects and subnets are spread across zones and identify root zones that are overly large or too small to be meaningful.
File zone_prefix_summary.csv
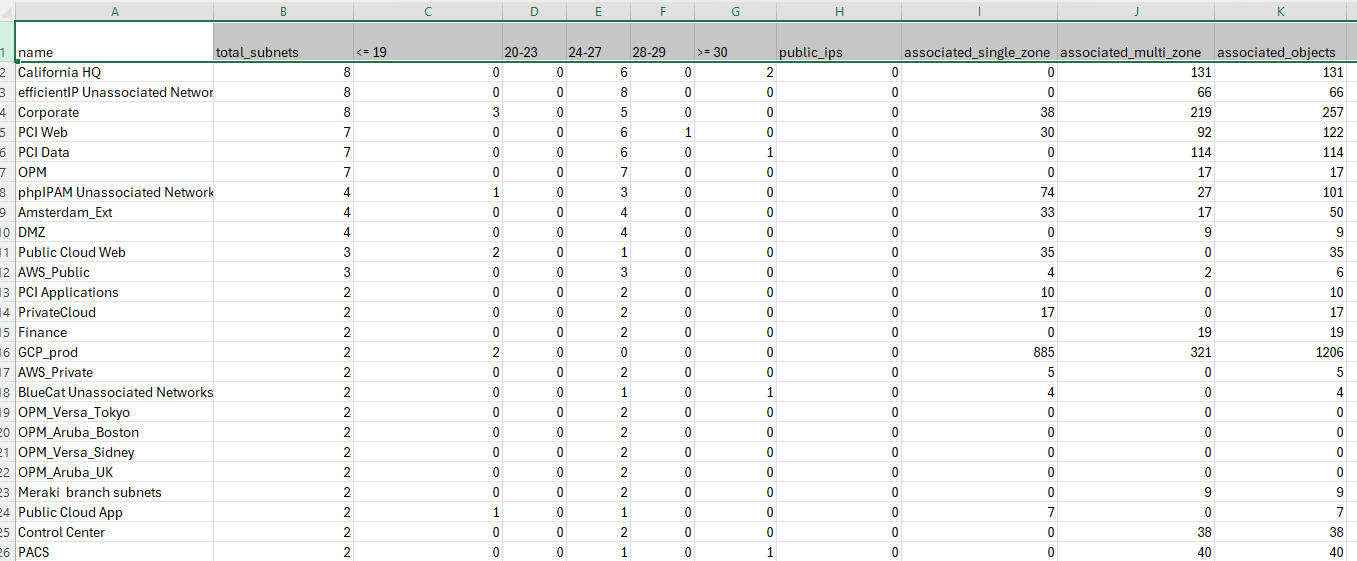
Lists all zones with the number of subnets in each range of prefixes (subnet sizes).
|
Column |
Description |
|---|---|
|
name |
The name of a zone. |
| total_subnets | The total number of subnets in the zone. |
| <= 19 | The total number of subnets in the zone that are equal to or less than CIDR /19. |
| 20-23 | The total number of subnets in the zone that are in the CIDR range /20 to /23. |
| 24-27 | The total number of subnets in the zone that are in the CIDR range /24 to /27. |
|
28-29 |
The total number of subnets in the zone that are in the CIDR range /28 to /29. |
|
>= 30 |
The total number of subnets in the zone that are equal to or greater than CIDR /30. |
|
public_ips |
The number of subnets containing public IPs. |
|
associated_single_zone |
The number of network objects in the zone that are unique to that zone. |
|
associated_multi_zone |
The number of network objects in the zone that appear also in other zones. |
|
associated_objects |
The total number of network objects in the zone. |
Example
Recommended best practices
Use this data to help you:
-
Understand how objects and subnets are spread across zones and identify root zones that are overly large or too small to be meaningful.
-
See whether subnet definitions are too broad and where finer segmentation may improve precision.
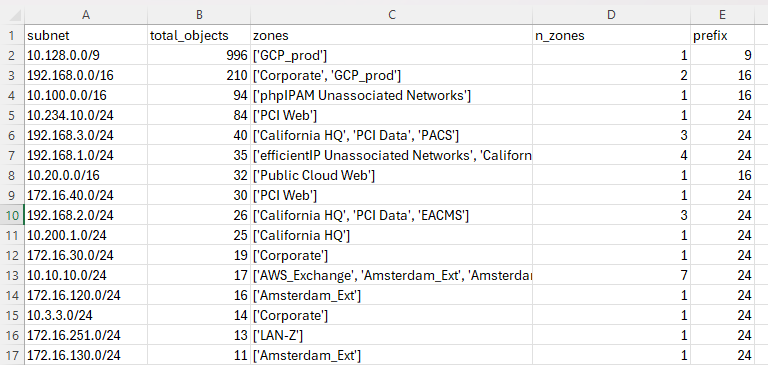
File subnets_set_up_report.csv
Lists all subnets defined in all zones, providing the number of objects contained in each and the names of the zones the subnet is associated with.
|
Column |
Description |
|---|---|
|
subnet |
The subnet definition as defined in TOS. |
| total_objects | The number of network objects in the subnet. |
| zones | The names of all the zones in which the subnet appears. |
|
n_zones |
The number of zones appearing in the zones cell. |
|
prefix |
The prefix of the subnet that appears in the subnet cell. |
Example
Recommended best practices
Use this data to help you identify subnets that contain no objects or are otherwise not contributing meaningful value to the current segmentation model.
Was this helpful?
Thank you!
We’d love your feedback
We really appreciate your feedback
Send this page to a colleague