On This Page
Investigating Traffic Paths
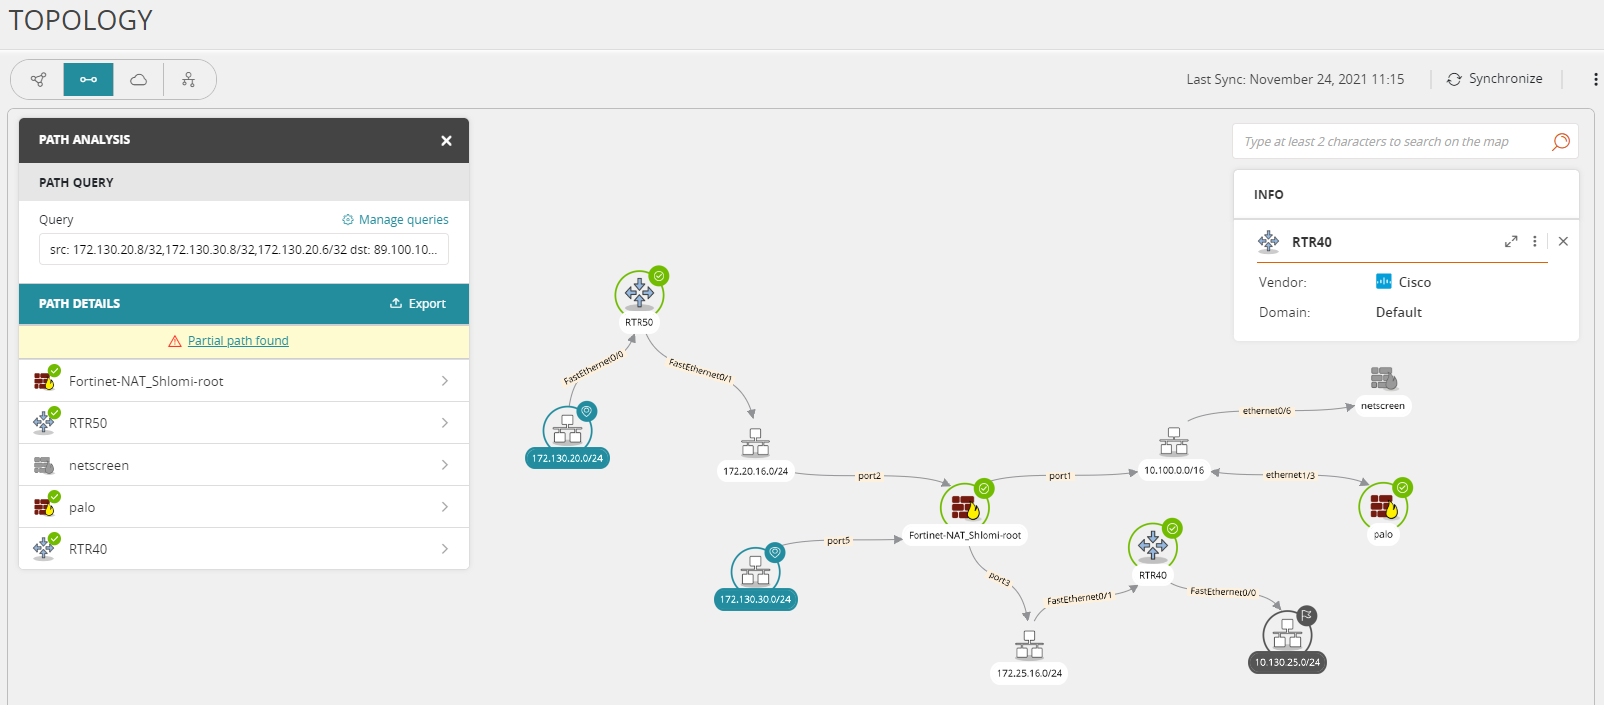
Click  to display the Path Analysis panel. Enter the traffic details of devices and cloud platforms for the paths you want to investigate, including the source, destination, and the predefined services or predefined application identities (optional). This panel displays the selected path in the order of the minimum distance (least number of hops) from any source to any destination. Devices with an equal distance between the source and destination are listed in alphabetical order.
In the interactive map you can enter the name of a firewall object (host, subnet, IP range, LDAP users, or group), or an IP address. To search for a user group, enter user.name in front of the group. For example: user.name/QA-devices. For IP addresses, IPv4 is supported for all devices and IPv6 is supported for specific devices. See SecureTrack Features by Vendor.
Click Export next to the search result to generate a PDF report with details of the search results, including matching rules, interfaces, and NAT information. If there are multiple paths, you can select which paths to include in the report. The report includes a map of the paths and details of each device in a path.
Click Manage queries to create and manage path queries.
The icons on the map are:
|
Icon |
Meaning |
Description |
|---|---|---|

|
Start point |
|

|
Routes traffic | Device that allows traffic. |

|
Drops traffic | Device includes a rule that blocks traffic. |

|
Incomplete path | Source traffic goes to this point, but does not reach the destination. |

|
End point | Last element that SecureTrack can identify in each path. If the next device in the path is an unmonitored device, SecureTrack shows the end point in a cloud. |
|
|
Directional arrow |
Direction of the modeled traffic (Traffic can also be bidirectional) |

What can I do on this page?
-
Select an object: Click the object.
-
Add objects to the list of selected objects: Ctrl-click multiple objects or type text, contained in the object name, in the search box.
-
Reveal actions for objects: Right-click the object or open the information menu for the selected objects.
-
For each object, you can:
- Drag and drop the object in the Interactive Map
-
For monitored devices - Show routes and interfaces
For default route use the value 0.0.0.0/0
-
For networks: Set as source or destination for path analysis
When a path is highlighted, in the Path panel you can select a device or cloud platform that passes the traffic. This lets you view the incoming interfaces (for cloud, coming from) and the next devices (for cloud, going to).
From R24-1 Access Requests for Check Point targets will no longer be able to contain LDAP and other object types together in the same source field. Instead, you will need to create a separate AR for each source type in the ticket.
How Do I Get Here?
- Navigate to the Interactive Map: In SecureTrack, click Network > Interactive Map.
- Click .
