On this page
Monitoring VMware NSX On-prem, AVS, GCVE
Overview
TOS monitors VMware NSX for policy revision changes. You can monitor NSX devices deployed on these platforms: on-premises, AVS (Azure VMware Solution), and GCVE (Google Cloud VMware Engine).
To monitor VMware Cloud (VMC) on AWS, see Monitoring VMware VMC on AWS.
To see which TOS features are supported for your device, review the SecureTrack Features by Vendor.
Prerequisites
- Monitoring: You must have a user with read-only permissions for the NSX manager, and a user with at least read-only permissions for the vCenter server. See Creating Read-only accounts for NSX devices for details.
- Provisioning: You must have a user with admin permissions.
By default, changes to unlogged rules do not trigger new revisions on TOS. Therefore, unlogged changes created by tools such as Service Composer will not trigger a TOS revision. See Tracking Unlogged Rules for details.
Add a device
-
Select VMware NSX > NSX:
-
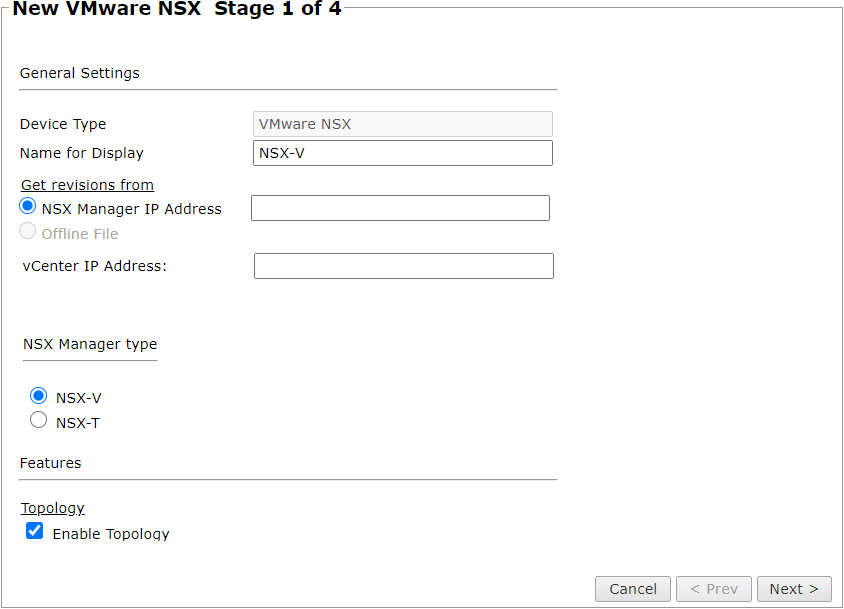
Configure the device settings:
-
Name for Display
-
Domain: Available only if you have configured your system for managing multi-domains and All Domains is currently selected. Select the domain to which to add the device. The Domain can only be entered when adding a device; to change the Domain, you must migrate the device.
-
Get revisions from: Select one:
- NSX Manager IP Address: Enter the IP address of the NSX manager.
- Offline File: (If available) Revisions are manually uploaded to TOS for Offline Analysis.
-
Enable Tracking of Rule Usage for Distributed Firewall: Selected by default.
-
Enable Rule Optimizer Recommendations: Selected by default. Collect and save traffic usage data for Rule Optimizer recommendations.
-
Enable Topology: Selected by default. Collect routing information for building the network Map.
Topology options for Advanced management mode are configured when you import managed devices.
-
Collect dynamic topology information: Select if the device uses dynamic addressing such as DHCP or dynamic routing protocols such as OSPF.
-
ST server: Appears only if you have one or more remote clusters. Select the cluster to monitor this device (not shown in image).
-
-
Click Next.
-
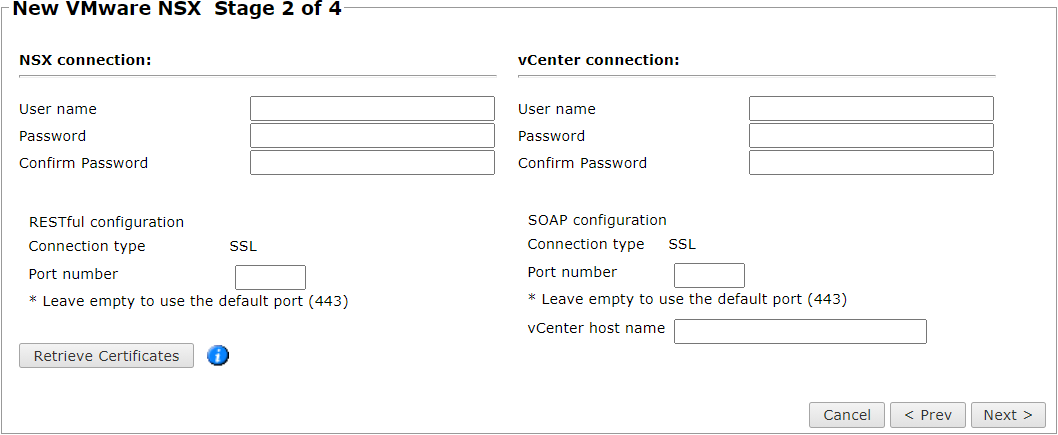
Enter the credentials to connect to the device.
-
Enter admin credentials for the NSX manager
-
To use default settings (recommended in most cases), leave the Port number blank.
-
Click Retrieve Certificate to setup encrypted communication between TOS and the VMware device.
The certificate, and the following message, appear:

The certificate is retrieved from the vCenter over port 8443.
-
-
Click Next.
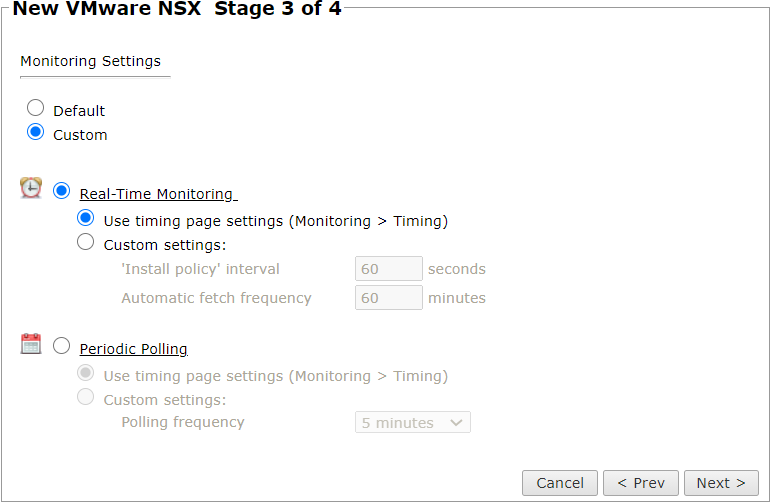
The Monitoring Settings page appears:
-
To use timing settings from the Timing page, select Default. Otherwise, select Custom and configure the monitoring mode and settings:
-
Real-Time Monitoring: Applies only if syslogs are configured. In Custom settings:
- 'Install policy' interval: When two or more Install Policy events for the same policy occur within this time interval, TOS combines the events into a single Install Policy revision (Default: 60 seconds)
- Automatic fetch frequency: Frequency (in minutes) for automatic fetch
-
Periodic Polling, select Custom settings and configure the Polling frequency: How often TOS fetches the configuration from each device.
If you select 1 day, you can then select the exact time (hour and minute) for the daily polling.
-
-
Click Next.
-
Save the configuration.
The VMware device now appears in the Monitored Devices tree.
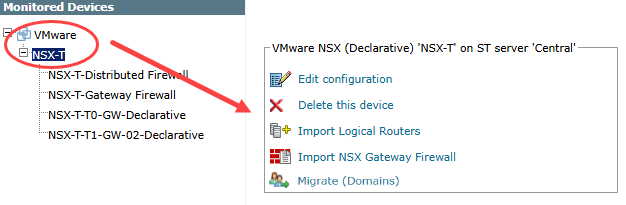
Configure a monitored device
After you add a device, further configuration options are available.
Options vary depending on your environment.
-
Edit configuration: Use the wizard to modify selected device settings. See Add a Device in this topic.
-
Delete this device: Type yes to confirm that you want to delete the device.
-
Import Logical Routers: Select the Logical Routers to import.
-
Import NSX Gateway Firewall: Select the NSX Gateway Firewall to import. These devices enforce inbound and outbound workloads for the network. SecureTrack will collect NSX Gateway Firewall policies for all monitored NSX Logical Routers. Note that TOS will only collect policies for those gateways that are imported into TOS.
-
Migrate (ST servers): Available in distributed deployments. Select the server where the device will be monitored and click Migrate.
-
Migrate (Domains): Available in multi-domain deployments. Select the domain where the device will be monitored and click Migrate.
How do I get here?
SecureTrack > Monitoring ![]() > Manage Devices
> Manage Devices
Was this helpful?
Thank you!
We’d love your feedback
We really appreciate your feedback
Send this page to a colleague