On this page
Monitoring Cloud-Delivered Cisco FMC
Overview
SecureTrack monitors Cisco cloud-delivered Firewall Management Center (cdFMC) devices for policy revision changes.
Firewall Management Center was formerly Firepower Management Center.
To see which TOS features are supported for your device, review the SecureTrack Features by Vendor.
Prerequisites
-
 An API URL and API Key for the cdFMC device
API URL: You can take this from the cdFMC URL.
Example

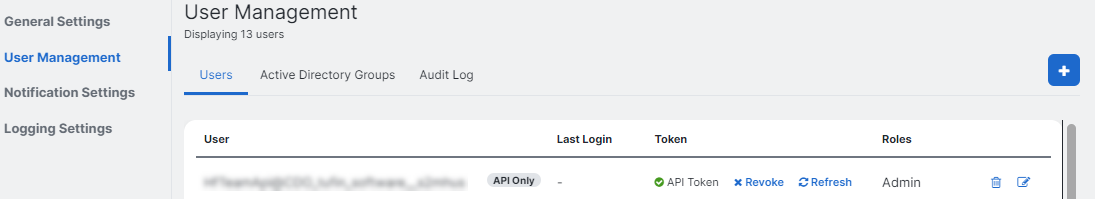
API Key: You can find this in the cdFMC user interface, in the User Management tab.
Example
-
Separate authentication credentials for both SecureTrack and SecureChange.
-
TOS and the monitored devices must be synchronized with the correct date and time, either manually or automatically. We recommend that you also configure the devices to resolve DNS queries.
-
Monitoring Cisco Firewall Management Center (FMC) devices requires HTTP access via port 443.
-
To collect Dynamic Topology information, make sure that SSH or Telnet access to the FTD is enabled.
-
At least one of the following user roles is required:
-
Administrator (required from version 7.4 and later)
-
Custom user role that provides Read Only access to APIs
-
Access Admin (version 7.3 and earlier)
-
Network Admin (version 7.3 and earlier)
-
-
To collect usage, configure the FMC device to send syslogs to TOS.
- The syslog device ID for the FTD device managed by the FMC is required to enable TOS to collect usage data.
-
The following commands to collect Dynamic Topology:
Command Description show route Extracts the routing table show interface Extracts the interfaces connect ftd Use this command to change the FTD context for running the show route and show interface commands -
Before you begin, confirm that the REST API is enabled.
-
If you use UCAPL mode, confirm that the REST API is disabled.
-
In the FMC, go to System > Configuration > REST API Preferences > Enable REST API.
-
Check Enable REST API.
-
Click Save.
Save Successful displays when the REST API is enabled.
In the Cisco Firewall Management Center (FMC), the REST API is enabled by default:
Enable the REST API
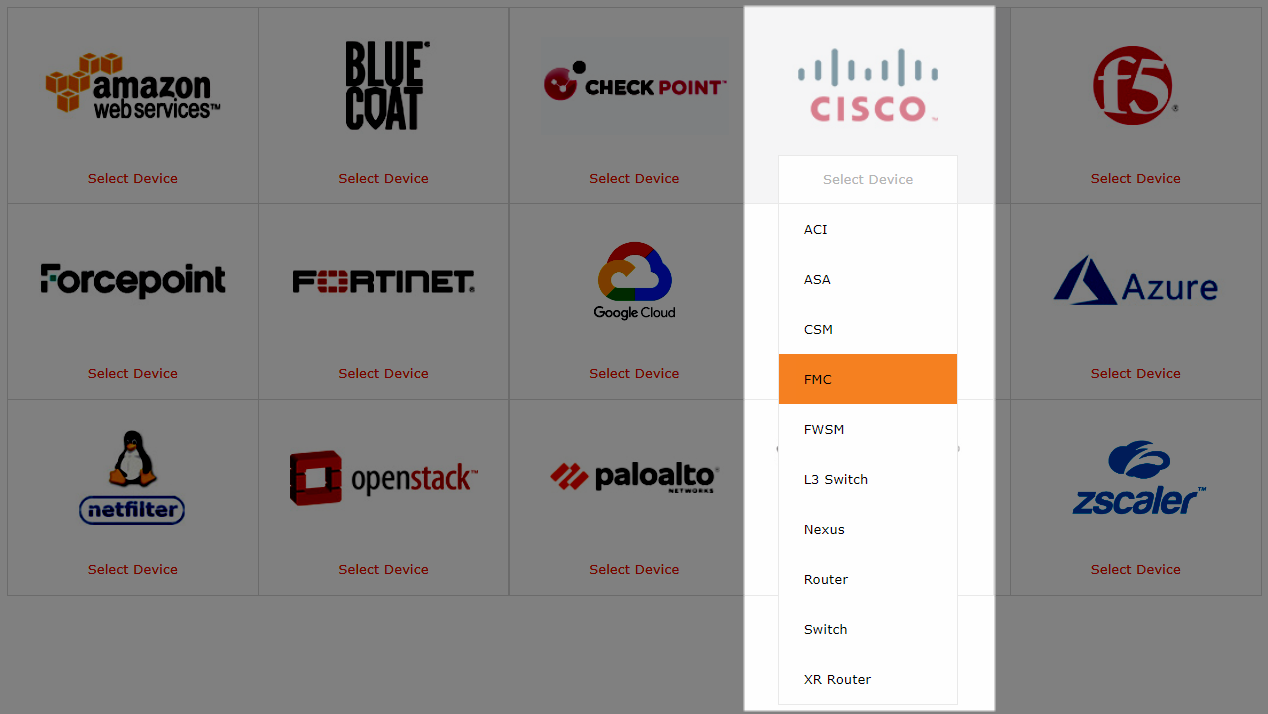
Add a device
-
Select Cisco > FMC:
-
Configure the device settings:
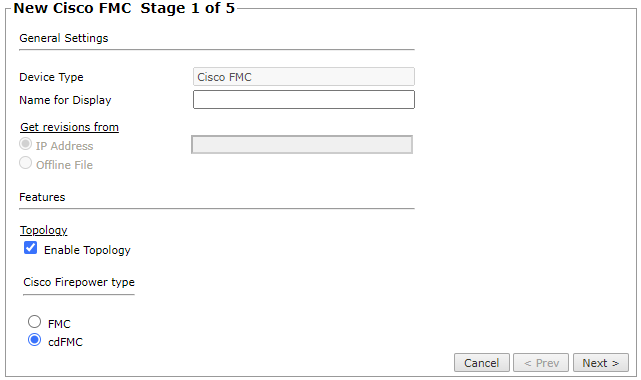
- Name for Display
-
ST server: In a distributed deployment, select which TOS cluster monitors this device (not shown in image)
-
Enable Topology: Collects routing information for building the network Map.
-
Cisco Firepower type: Choose cdFMC.
For non-cloud FMC devices, see Monitoring FMC Devices.
-
Click Next.
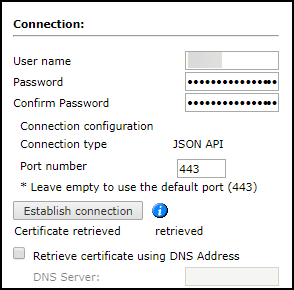
- Enter the API key and API URL.

Click Establish connection to set up encrypted communication between TOS and the Cisco device. The following message appears:

-
Click Next.
-
Configure the Syslog authentication:
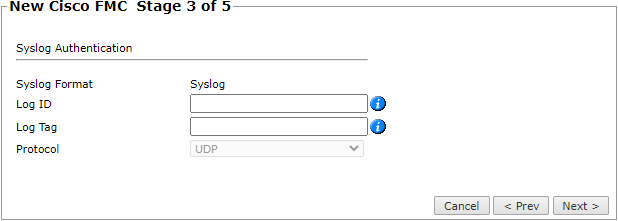
- Log ID: The Log ID which corresponds to the User Defined ID in the FMC Syslog Settings. This tag is used for Data Usage.
- Log Tag: The Tag ID which corresponds to the Tag configured in Configuration > Audit Log > Tag. This tag is used for Accountability. You cannot define the same Tag ID in multiple FMC devices.
- Protocol: The Protocol is UDP by default and disabled.
-
Click Next.
-
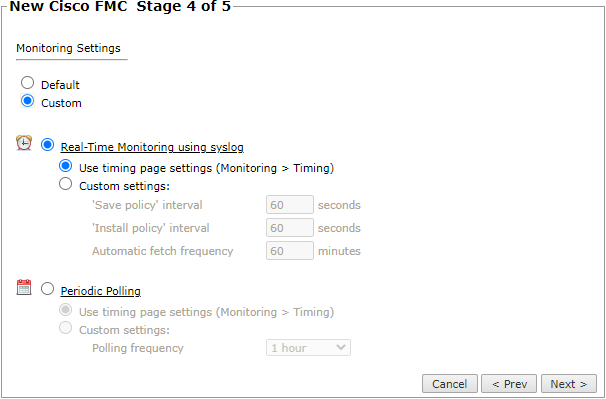
In Monitoring Settings, do one of the following:
-
Select Default to use the default time configured in Periodic Polling (1 hour).
-
Select Custom and configure the monitoring mode and settings.
For both Custom options, you can use the timing page settings
-
Real-Time Monitoring using syslog - Select Custom settings to configure the 'Save policy' interval, 'Install policy interval', and Automatic fetch frequency.
For more information, see Configuring a Cisco FMC to Send Syslogs.
-
-
Periodic Polling: select Custom settings and configure the Polling frequency (jow often TOS fetches the configuration from each device).
If you select 1 day, you can then select the exact time (hour and minute) for the daily polling.
-
-
Click Next.
-
Save the configuration.
The Cisco device now appears in the Monitored Devices tree.
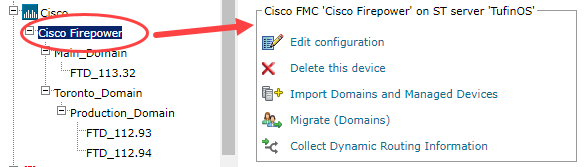
Configure a monitored device
After you add a device, further configuration options are available.
Options vary depending on your environment.
Example:
-
Edit configuration: Use the wizard to modify selected device settings. See Add a Device in this topic.
-
Delete this device: Type yes to confirm that you want to delete the device.
-
Migrate (ST servers): Available in distributed deployments. Select the server where the device will be monitored and click Migrate.
-
Migrate (Domains): Available in multi-domain deployments. Select the domain where the device will be monitored and click Migrate.
Edit the configuration of a managed Cisco firewall device
-
Select the Cisco firewall device from the device tree.
-
Click Edit Configuration.
-
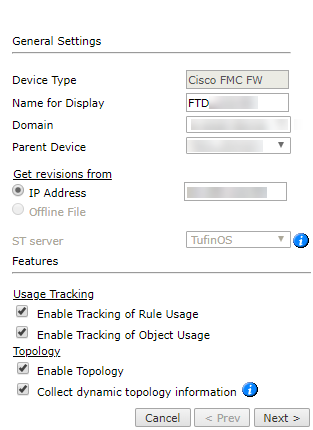
Edit the General Settings.
-
In the Usage Tracking section:
- Enable tracking of rule usage: Select to enable usage for rules to be collected and saved in the SecureTrack database.
- Enable tracking of object usage: Select to enable usage for objects in rules to be collected and saved in the SecureTrack database.
If these options are selected:
- The collected usage appears in the Last Hit column in Rule Viewer.
- Automatic Policy Generation (APG) is enabled.
- The Rule and Object Usage Report is enabled.
-
In the Topology section:
- Enable Topology: Collects routing information for building the network Map.
-
Collect dynamic topology information: Enables dynamic topology collection when dynamic addressing (DHCP) or routing protocols (OSPF and BGP) are in use.
When dynamic topology is enabled:
- Both static and dynamic routes are displayed on the Map.
- Static routes are not shown as part of the revisions.
-
Click Next.
-
Edit the connection details and click Next.
-
Click Save to complete the device configuration.
How do I get here?
SecureTrack > Monitoring ![]() > Manage Devices
> Manage Devices
Was this helpful?
Thank you!
We’d love your feedback
We really appreciate your feedback
Send this page to a colleague