On This Page
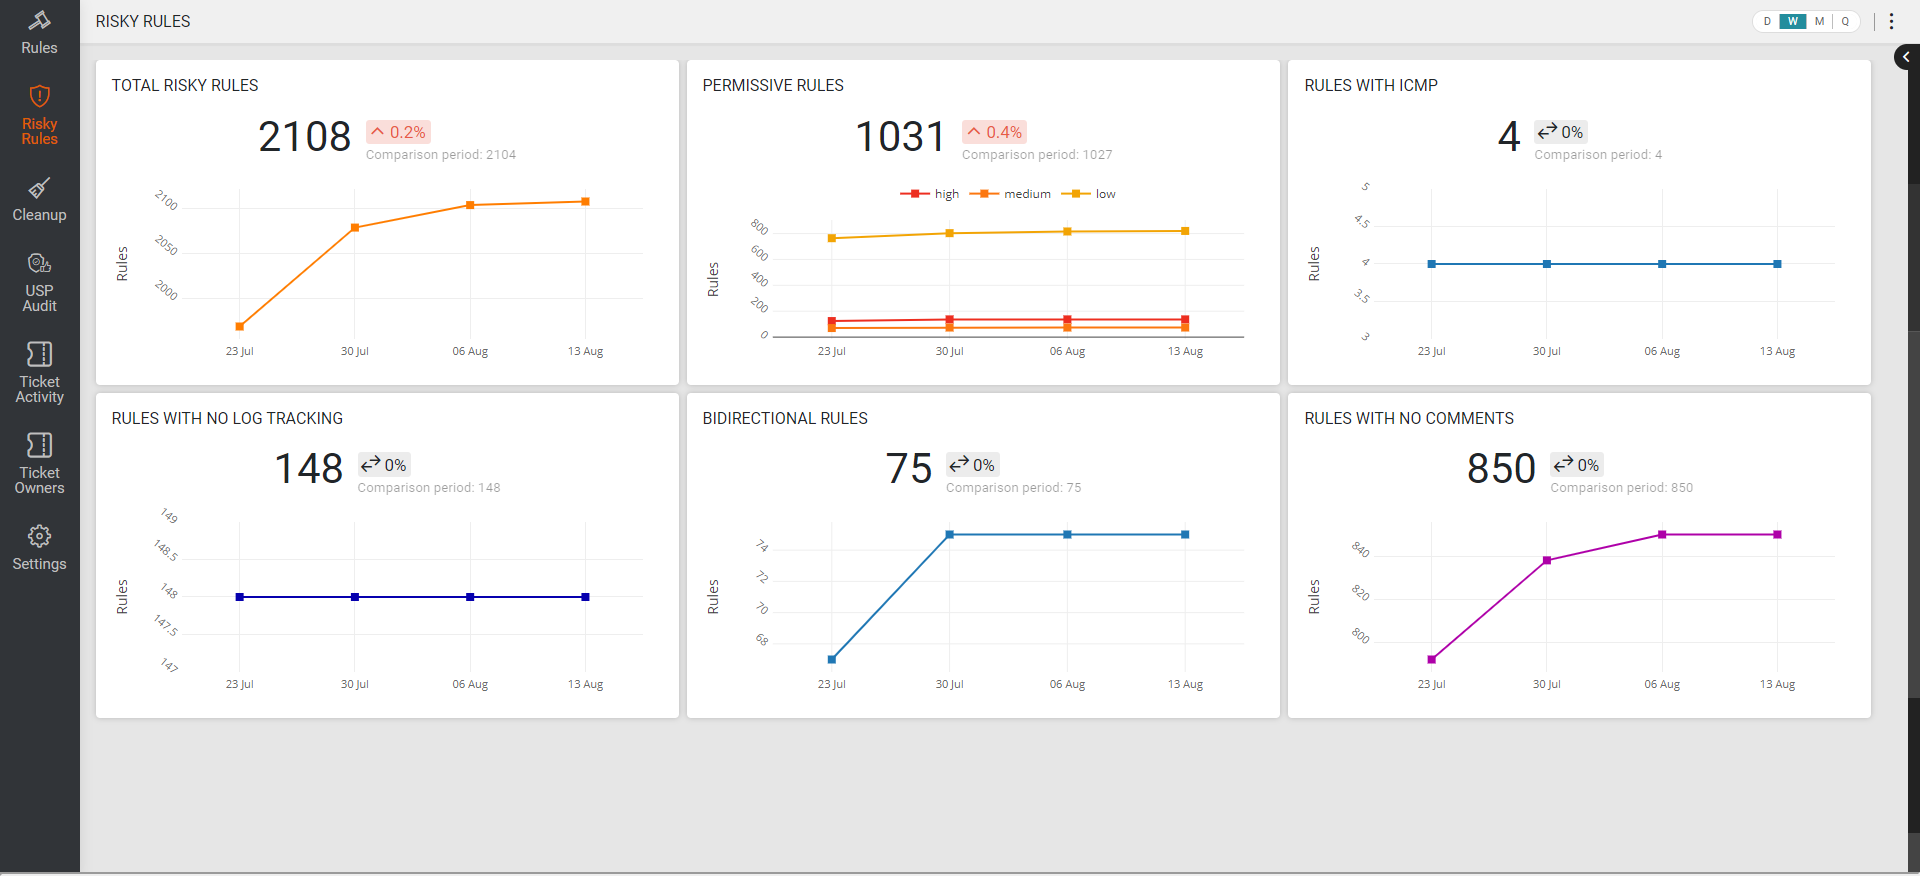
Risky Rules Dashboard
Overview
You use the Risky Rules dashboard to see trends in SecureTrack for a set of rule-based metrics with an emphasis on risky behavior.
Information in this dashboard is important for Risk and Compliance auditors to track how many rules in your network violate security best practices. For more details about these violations, run the SecureTrack Reporting Essentials Security Best Practices Report. Unified Security Policies are not a prerequisite for this dashboard.
This dashboard answers the following questions:
-
Has my network rule base become more secure or less secure over time?
-
How many risky rules are in my rule base?
-
Which types of risky rules are most prevalent?
What Can I see Here?
For the following metrics, this dashboard shows totals, trends, and the delta from the last time that the data was collected:
-
Total Risky Rules: Provides an overview of all potentially high-risk rules identified within the other metrics in this dashboard.
-
Permissive Rules: Rules that, according to their source/destination/service definitions, allow too much access through the firewall.
-
Rules with ICMP: Shows statistics related to problems with data transmission.
-
Rules with no Log Tracking: Rule modifications that are not published to the audit log.
-
Bidirectional Rules: Rules with traffic in both directions - Source > Destination and Destination > Source.
-
Rules with no Comments: Comments provide the purpose for the rule and are required for business justification.
What Can I do Here?
Use the Graphs
Slide the graph to see dates before or after the current view.
Highlight Bars
Hover on a bar in a bar graph to see the number of objects that match the corresponding color in the graph legend.
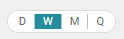
Change the Aggregation Setting
Select the setting (Day/Week/Month/Quarter) to determine the aggregation of the dashboard data.
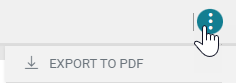
Export Dashboard
Select the Action list (![]() ) to export the dashboard to PDF. The extension downloads the dashboard to a PDF file on your computer. You can use this file to document progress or update stakeholders.
) to export the dashboard to PDF. The extension downloads the dashboard to a PDF file on your computer. You can use this file to document progress or update stakeholders.
Force Data-Collection Sync
Dashboard Essentials syncs with TOS every 24 hours. However, you can use this feature to force a data-collection sync manually with SecureTrack/SecureChange to get the most up-to-date metrics.
How Is the Data Calculated?
The Risky Rules dashboard uses the following TQL queries:
-
Total Risky Rules: (comment not exists or logged = false) or ((permissivenessLevel = 'MEDIUM' or permissivenessLevel = 'LOW' or permissivenessLevel = 'HIGH' or service.protocol = '1' or service.protocol = '58') and action = 'ALLOW') and disabled = false
The Total Risky rules graph does not include bidirectional rules.
-
Permissive Rules:
-
permissivenessLevel = 'HIGH' and disabled = false and action = 'ALLOW'
-
permissivenessLevel = 'LOW' and disabled = false and action = 'ALLOW'
-
permissivenessLevel = 'MEDIUM' and disabled = false and action = 'ALLOW'
-
-
Rules with ICMP: (service.protocol = '1' or service.protocol = '58') and disabled = false and action = 'ALLOW'
-
Bidirectional Rules: Does not use TQL
-
Rules with No Log Tracking: logged = false and disabled = false
-
Rules with No Comments: comment not exists and disabled = false
