On This Page
Policy Analysis Report
Overview
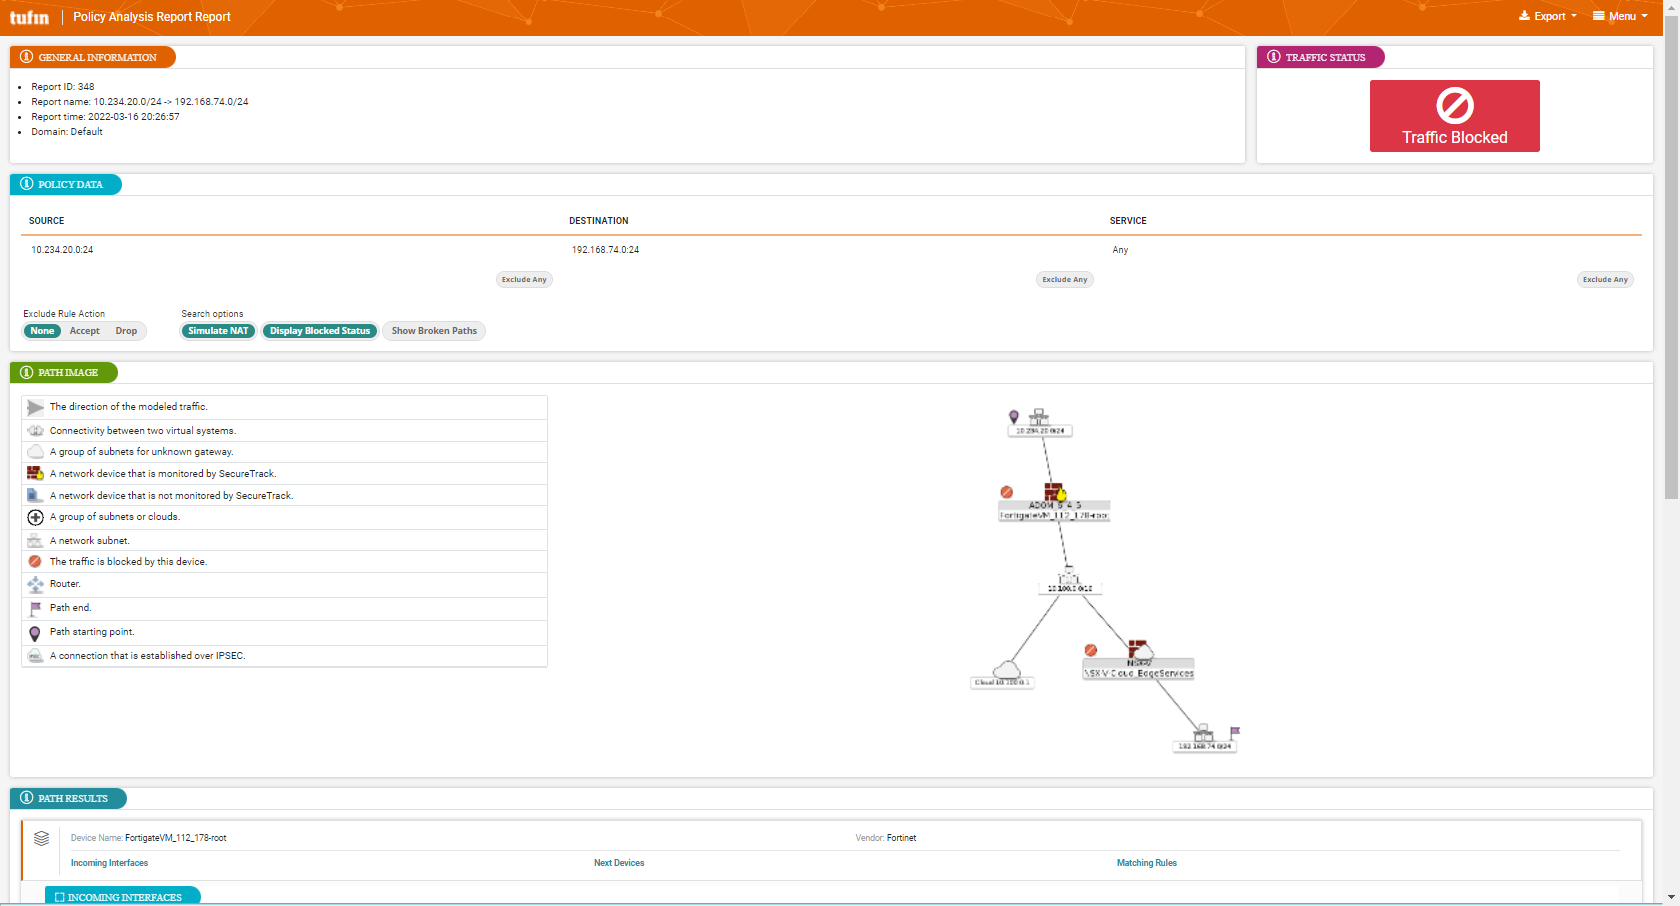
The Policy Analysis report displays all data related to handling the traffic defined in the query, including relevant devices, interfaces, and rules, as well as a diagram that presents one or more paths for the specified traffic. Data in this report is based on topology intelligence from SecureTrack.
This report enables you to:
-
Identify which devices and rules are blocking traffic.
-
Expedite troubleshooting, and determine what needs to be changed to allow or block traffic.
-
Ensure consistent reporting on business-critical connectivity.
What Can I See Here?
General Information
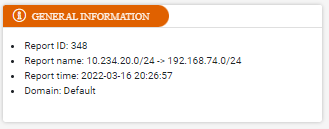
The General Information section includes details such as the report ID, name, time, and domain.
Traffic Status
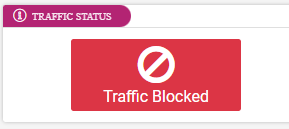
This section shows the allowed/blocked status of traffic.
Policy Data
For the selected devices, this section shows the source, destination, service, and search options applied to this report.
Path Image
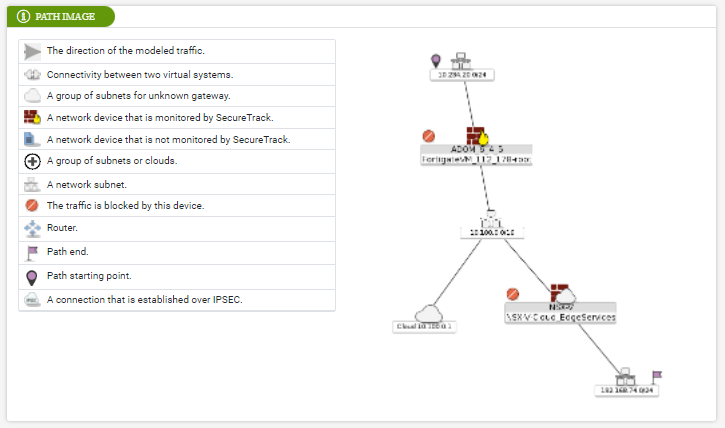
This section shows the Interactive map for the selected devices.
Path Results
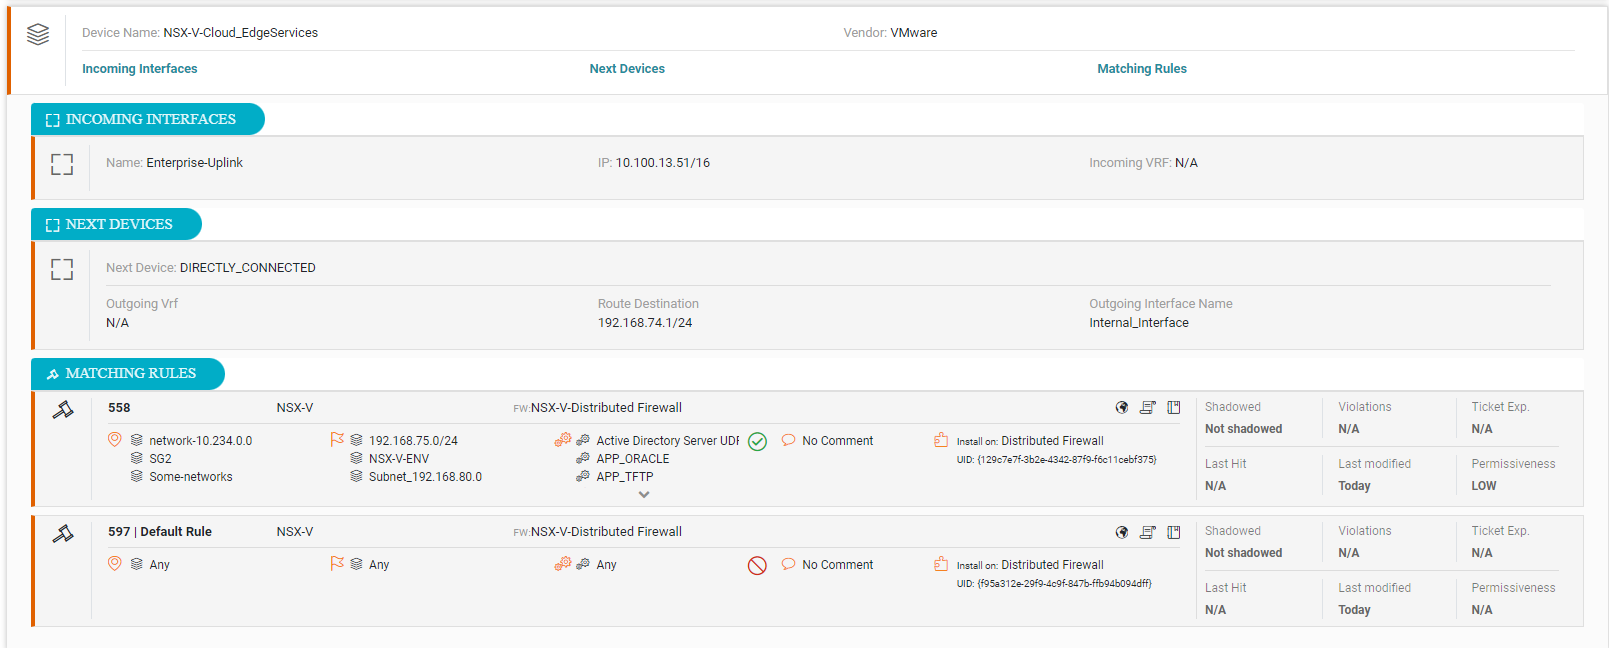
For each network device in the path that is monitored by SecureTrack, you can see details for the device in the Path Results section.
Click the toggle links to open/close information panes:
-
Incoming Interfaces: Interfaces into the selected device.
-
Next Devices: Devices after the selected device in the path.
-
Matching Rules: Cards that include information about each rule.
Create a Policy Analysis Report
Prerequisites
-
In the Settings > General page, the administrator must configure the outgoing SMTP server and the remote repository.
Procedure
-
From the Create (
 ) menu, click Policy Analysis.
The Setup page for the report appears.
-
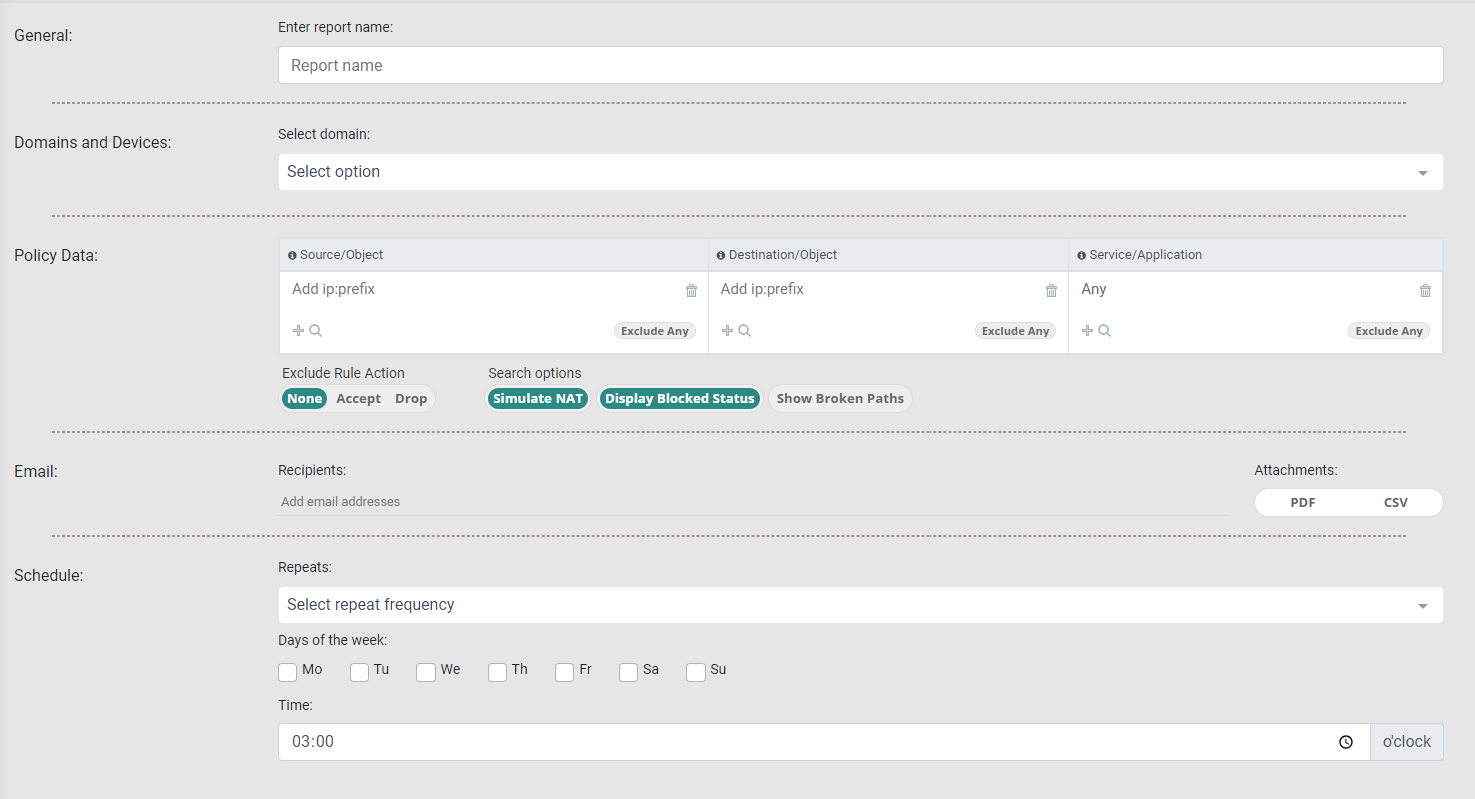
Complete the report fields:
-
General: Report name.
-
Domains and Devices: Select a domain.
-
Policy Data:
-
Source/Object: Gets an IP address and CIDR separated by a colon. Example: 1.1.1.1:32
-
Destination/Object: Gets an IP address and CIDR separated by a colon. Example: 2.2.2.0:24
-
Service/Application: For services, enter protocol (tcp and udp) and port separated by a colon. Example: tcp:80 or udp:21.
-
Exclude Any: Use this option to exclude rules, which have ANY in the souce/destination/service fields, from the report.
-
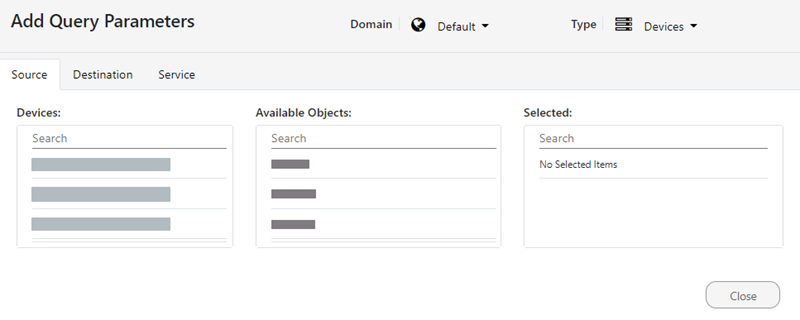
Search icon (
 ): Click this icon to search for predefined source/destination devices or applications. The Add Query Parameters window appears:
 -
Select the Domain and Type (Devices or Zones) to narrow your search.
-
Filter options:
-
Exclude Rule Action: Select an action for filtering rules (Accept, Drop, or None (neither Accept nor Drop)).
-
Search options:
-
Simulate NAT: When set, NAT simulation is used when calculating the path.
-
Display Blocked Status: When set, blocked traffic icons are displayed next to devices blocking the traffic.
-
Show Broken Paths: When set, all nodes in the path are displayed, even if the node cannot reach the destination, or if the source and destination are the same.
-
-
-
-
Export Report:
-
Email: Specify the recipients for notification emails. Press Tab or Enter to separate multiple email addresses.
The email message includes a link to the report in STRE.
Select the format of the report to include in the email as an attachment, as PDF, CSV, or both. Reports larger than 4 MB are compressed as
.zipfiles. -
Remote Repository: STRE can export reports using SFTP. Specify the report format - PDF or CSV.
If the report finished successfully, you can verify that the new files appear in the Reports Folder path, in the remote repository, configured by your administrator (see Send Reports Using SFTP).
-
- Schedule: Configure the following:
- Repeats: The frequency at which the report runs: Daily, Weekly, or Monthly.
- Days of the week: Available for Weekly and Monthly frequencies.
For Weekly, runs the report on each selected day at the specified time. For example, if you select Monday, the report runs every Monday.
For Monthly, this is one of two scheduling options. Runs report on the first occurrence of the selected day of the week in the month at the specified time. For example, if you select Monday, the report runs on the first Monday of the month.
- Calendar Month: Available only for Monthly frequencies. This is the second monthly scheduling option. Runs report on the 1st or 15th of the calendar month. Reports based on calendar months run automatically at midnight.
- Time: The time at which the report should run.
-
-
Click one of the following:
 : Saves the report. The Saved menu lists all saved and scheduled reports.
 : Runs the report. After a report runs, you can view the results in the Repo menu.
Available Report Formats
When viewing the report output, use the Export menu to save the report data.
You can save the data for this report as a CSV file or PDF file. The CSV export option is useful when you want to create your own reports based on the specific data from the report configuration.
