On This Page
Overview
The cloud graph lets you observe your cloud environment from top to bottom. It is a high-level view of your assets across multiple cloud accounts, showing their connectivity and risks (see violations). The cloud graph displays your assets as a hierarchy of groups, such as cloud accounts, VPCs, subnets and tag combinations, that you can organize and customize to your needs. You can expand any group on the page to view its components and continue to drill down to the individual assets, while getting visibility and risk information at every level.
What Can I See Here?
The Cloud Graph displays the hierarchical relationship of assets. At the top of the page, Group by shows the asset hierarchy, which you can change. The default view reflects the top-most level and you can use the +/- icons to expand or contract a level in the hierarchy. Assets that are not defined in any group at a certain level will be grouped into a default Not in any.. group (for example, Not in any Virtual Networks).
|
Entity on the Graph |
Description |
|---|---|
|
|
The Internet. |
|
|
One or more external IPs that can be accessed through a VPN or direct connection |
|
|
A group in the asset hierarchy (for example Account, Subnet, Virtual Network) that can be expanded further into other groups or assets |
|
|
VM (virtual machine) |
|
|
Storage |
|
|
Load balancer. In SecureCloud this represents one or more assets to which it routes traffic. |
|
|
Cluster |
|
|
Database |
|
|
The connection. Single or dual directional (see View Entity Details - Connections). The arrow color indicates whether this connection is permitted (black) or whether it violates the cloud policy (red). |
The icon colors reflect its condition:
-
Black: No violations found
-
Red: Violations found
-
Blue: Filtering applied
Examples:
-
 : No violations found and no filtering applied
 -
 : Violations found and no filtering applied
 -
 : No violations found and filtering applied
 -
 : Violations found and filtering applied
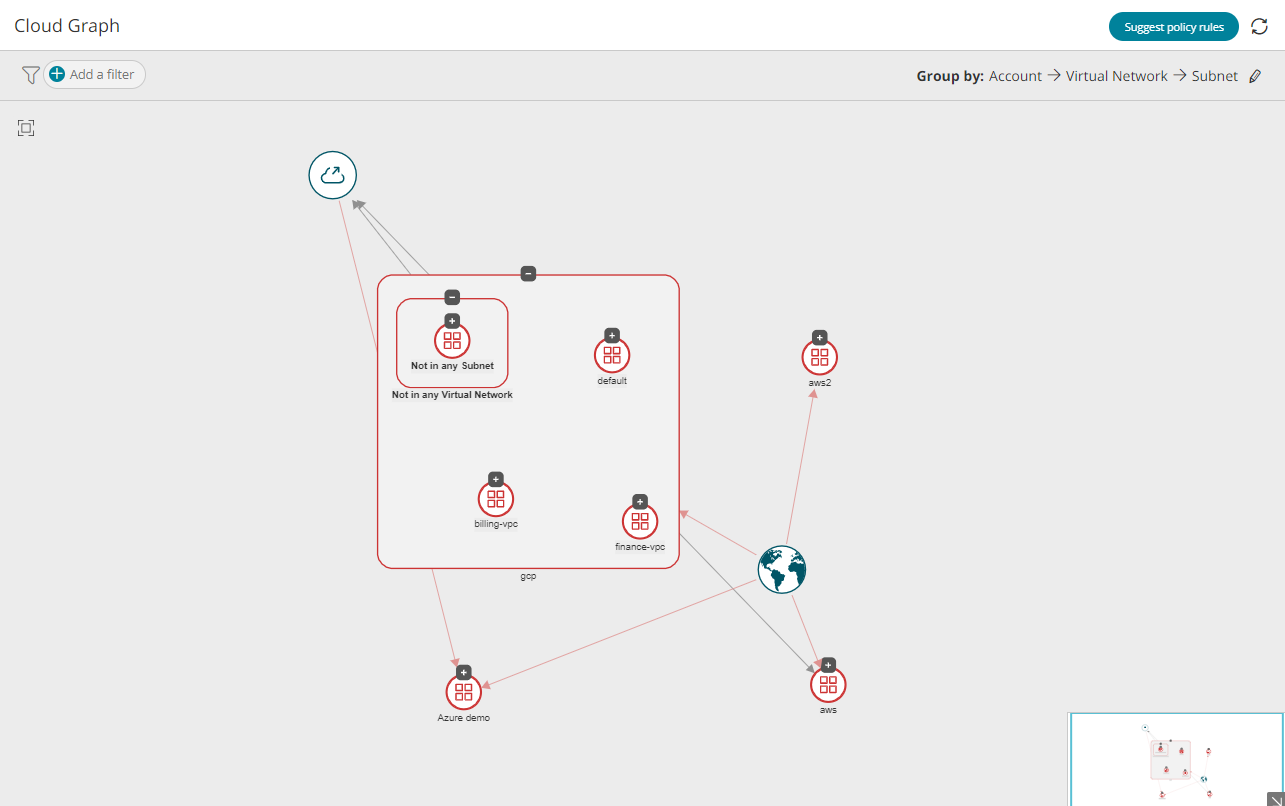
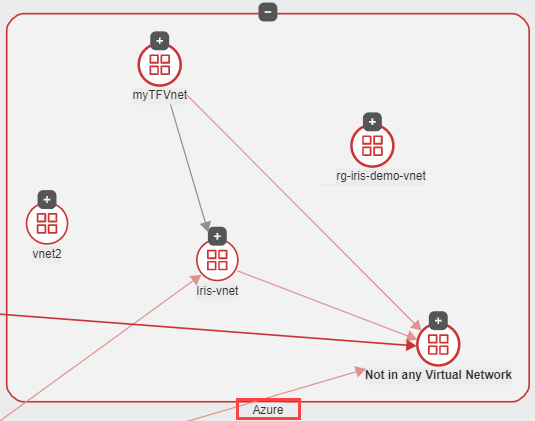
Example:
-
The asset hierarchy is defined as Account > Virtual Network > Subnet.
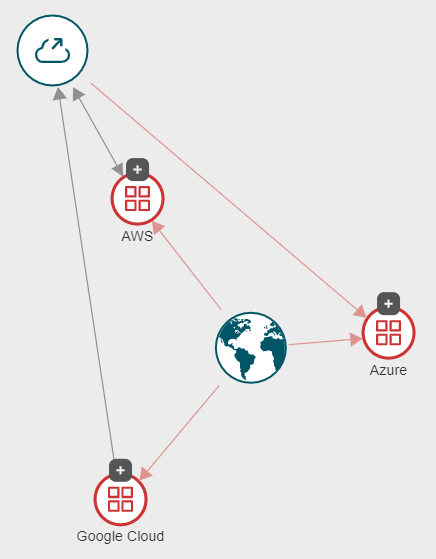
-
The cloud graph is displayed initially with assets grouped by account, the first level in the asset hierarchy.
-
Account gcp has been expanded to show its assets grouped by virtual network.
-
Assets that do not have any virtual network defined for them appear in the group Not in any Virtual Network.
Mini Map
A small map of the entire graph appears in the lower right corner of the screen, with the contents of the main screen appearing in a frame. When the main screen is not showing all the items in the graph, you can drag the frame within the mini map to shift the point of focus in the main screen.
What Can I do Here?
-
Reposition icons: Drag any icon on the screen.
-
Zoom using the mouse wheel or Ctrl/Command with the keyboard +/- keys - reset zoom by clicking
 .
. -
Traverse the graph: When the main screen isn't showing all the items in the Cloud Graph, grab the frame with the mouse and drag it to shift the point of focus.
Filter Graph Entities
You can add filters, to help you focus on certain asset properties and remove unconnected items from the graph. The filtered graph includes the filtered assets, their hierarchies, and all their connections.
Highlight Connections
Hover over an entity. All non-connected entities and connections appear grayed-out.
-
Click the entity to keep the highlighting when the mouse pointer is moved away.
-
Select multiple entities by holding down the Shift or Ctrl key on the keyboard when selecting the entity.
View Entity Details
Click an entity to highlight it and display the info panel. All non-connected entities and connections will be grayed-out until a new selection is made or the graph is redisplayed. The information will vary depending on the entity selected.
Select multiple entities by holding down the Shift or Ctrl key on the keyboard when selecting the entity. The information panel displays information relating to one entity only.
Click ![]() to filter on the current selected entities on the graph.
to filter on the current selected entities on the graph.
Groups
For groups, the panel includes information such as violations, cloud accounts, internet access, group members, and a list of all the tags defined for its associated assets.
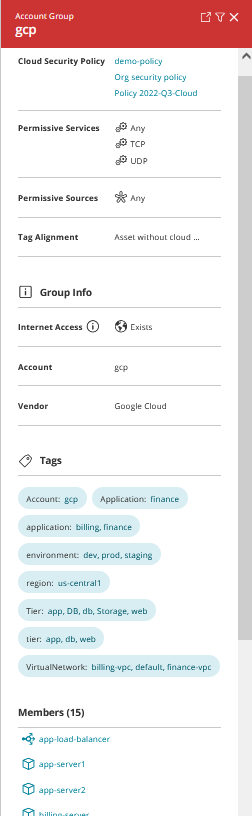
Click ![]() to display all assets contained in the group, in a separate panel.
to display all assets contained in the group, in a separate panel.
Assets
For assets, the panel includes information such as violations, policies, cloud accounts, subnet, vendor, and asset tags.
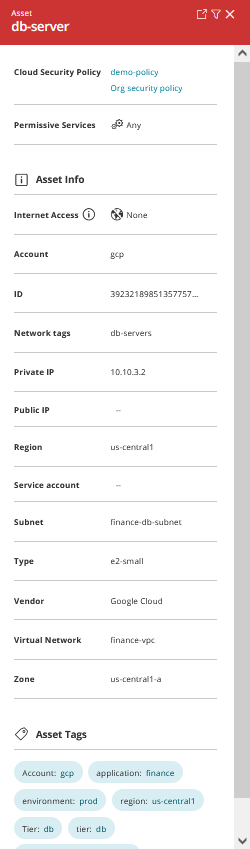
Click ![]() to open the asset overview in a separate tab.
to open the asset overview in a separate tab.
Note that the overview icon appears for accounts, regardless where the account appears in the hierarchy. When you click this icon for an account, a new browser tab opens showing all of its assets.
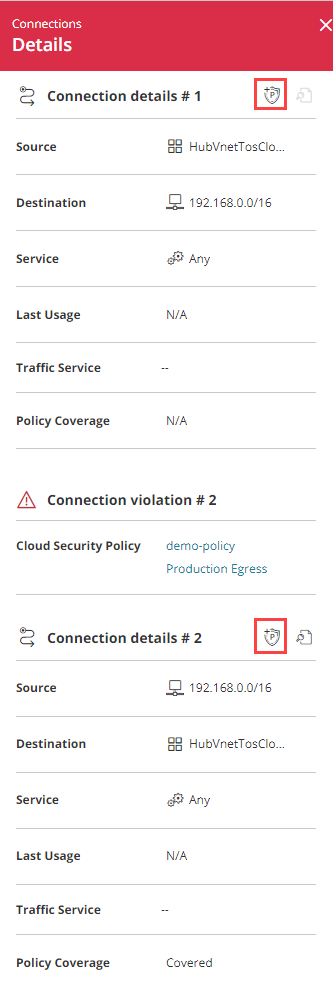
Connections
Connections can be one-way or bi-directional. Click any connection to see the info panel.
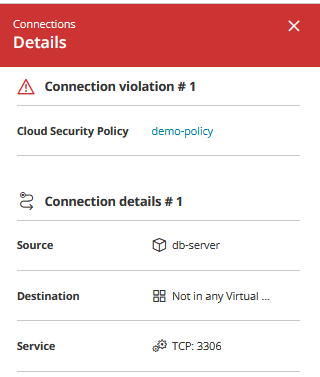
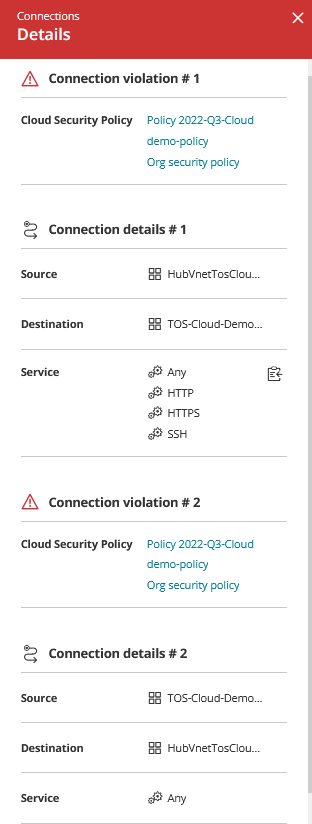
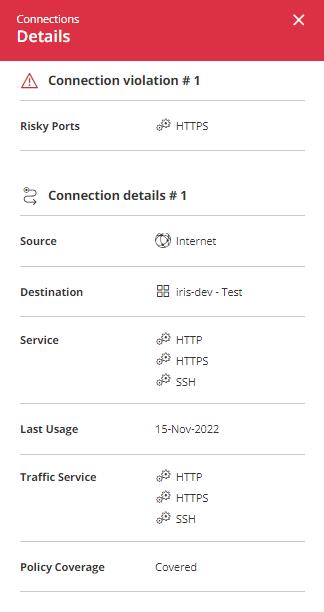
This panel includes the following information:
-
Violation details for the destinations
-
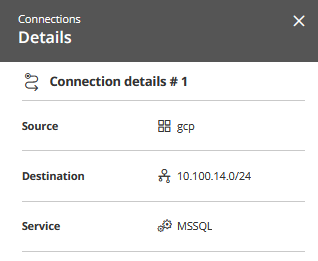
Connection details:
- Source, Destination, and Service
-
Last Usage: Last time that traffic passed through the connection.
-
Traffic Service: If traffic was detected, lists the services for the traffic.
-
Policy Coverage: Indicates if the connection between two entities is covered by a policy. Values include Covered, Not Covered, and N/A (for outbound connections to the Internet or External IPs). If the connection is to a group, the connection will only be considered Covered if all connections to the group are covered as well.
Connections to external IPs show the source and destination for the relevant IPs.
Click ![]() to show the covering policies and rules in a separate tab.
to show the covering policies and rules in a separate tab.
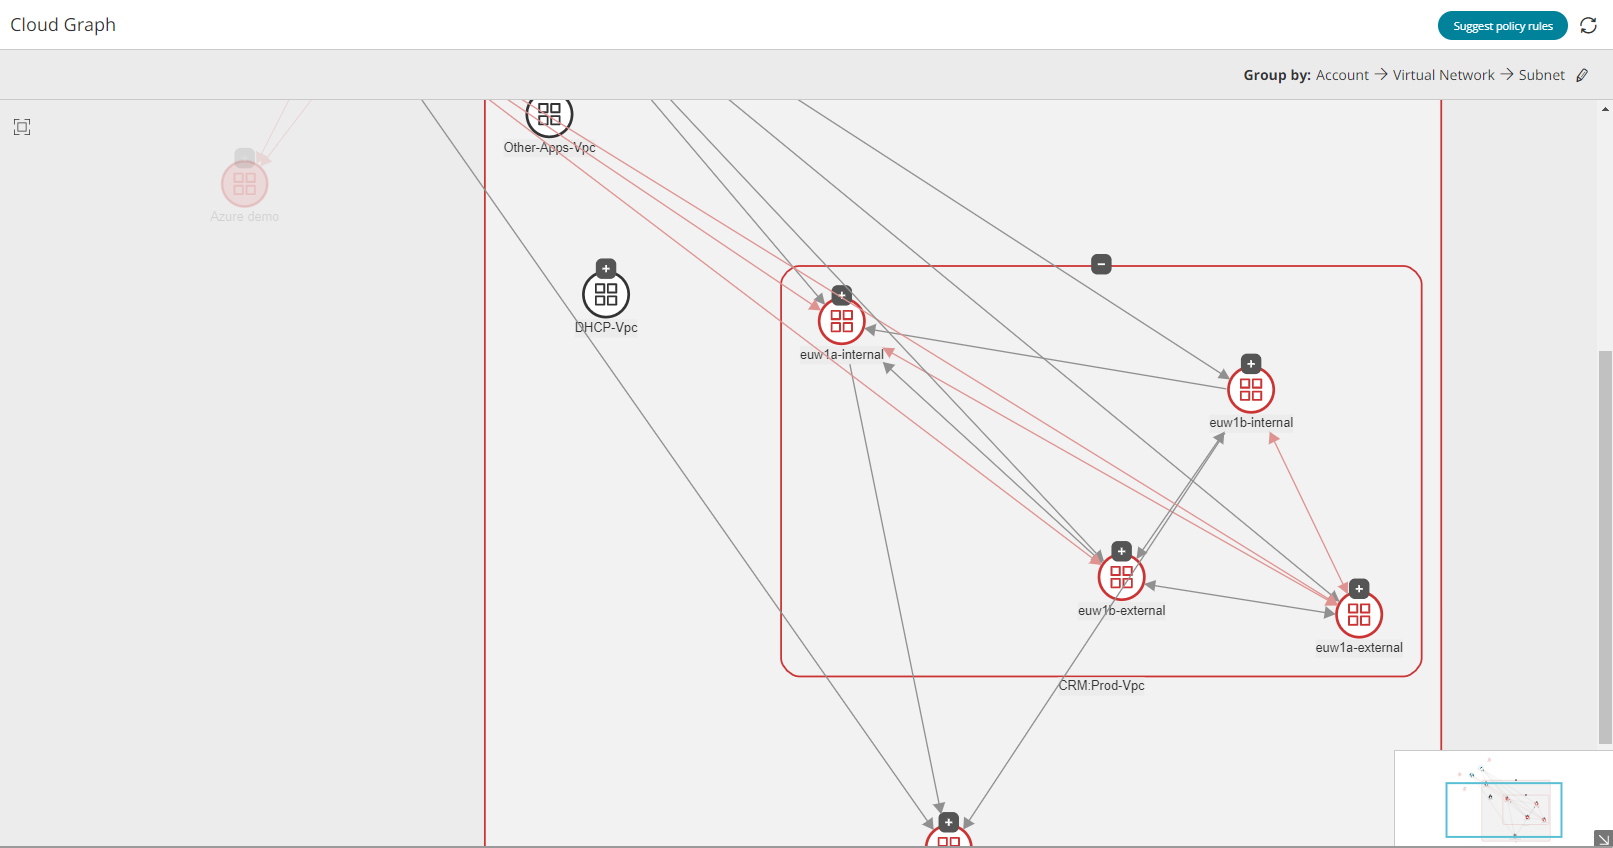
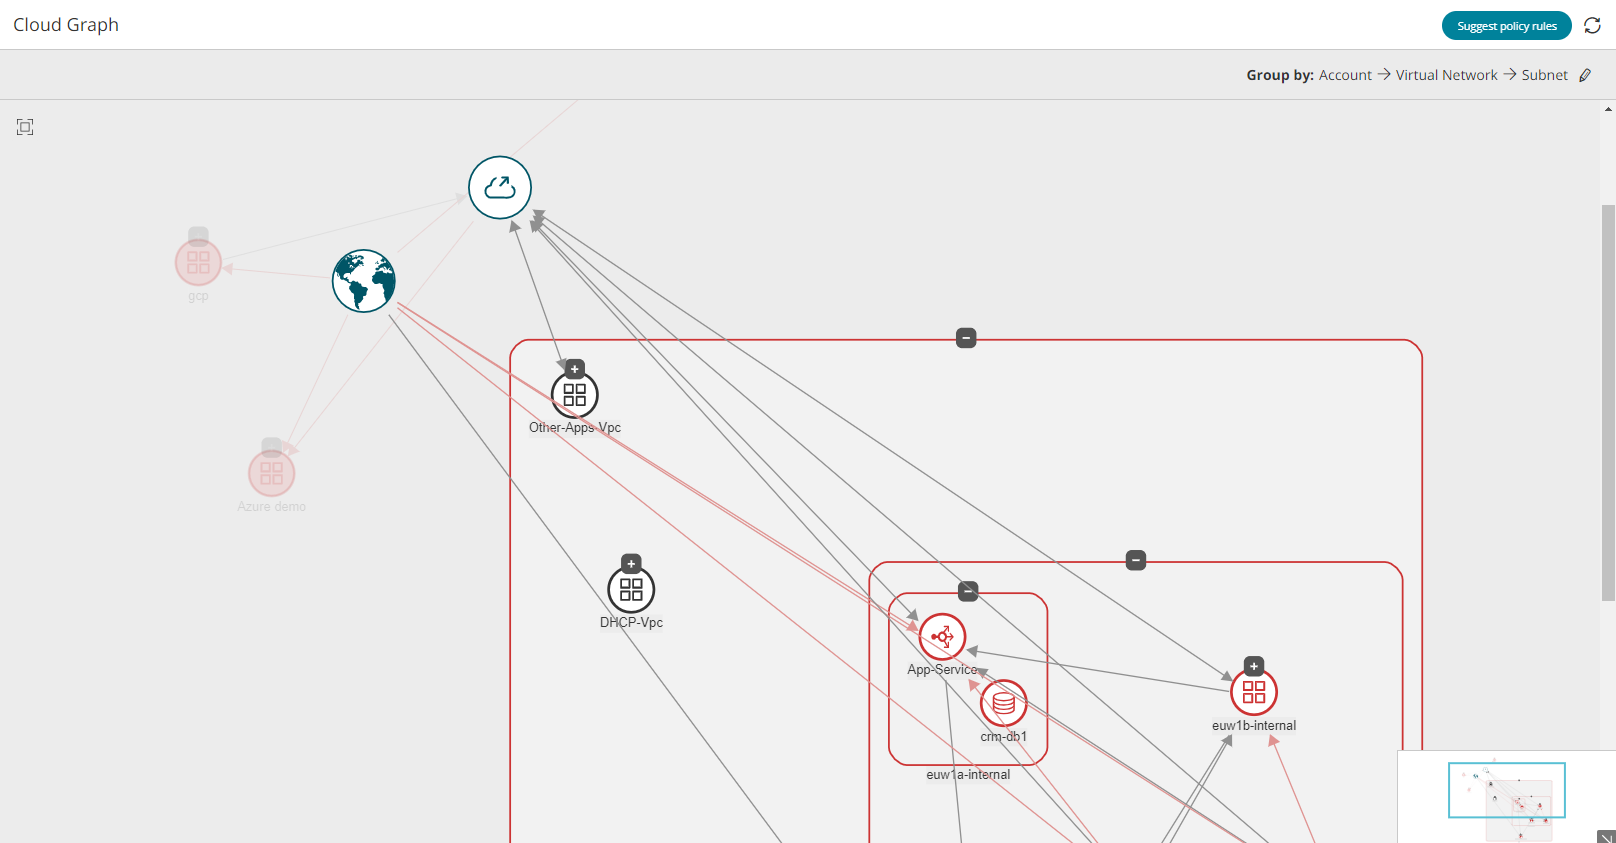
View Group Contents
Use the + icon to reveal the contents of a group. Each time you click this icon, you drill down to the next level in the hierarchy until you reach the asset level. Use the - icon to contract a level in the hierarchy.
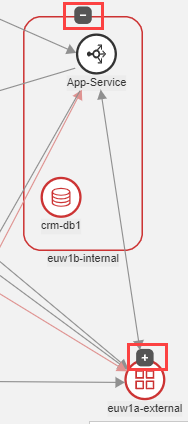
In this example, vendor is the first level:
You can click the + icon for a vendor to see the connectivity between the groups in its next lower level.
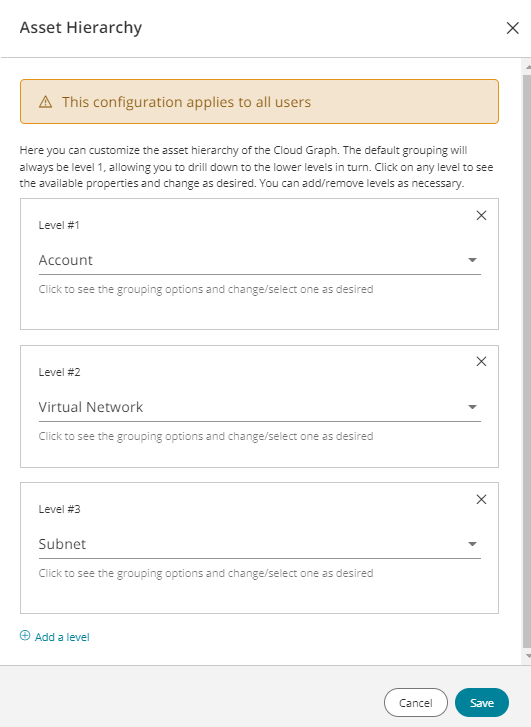
Change Asset Hierarchy
Assets appear in the cloud graph and asset graph as a hierarchy of groups. The default hierarchy is account > virtual network > subnet > assets. You can change this hierarchy at any time in asset grouping, cloud graph, or asset graph and immediately see the change reflected everywhere. This is a global setting that affects all users.
Options for hierarchy levels include:
- Account
- Vendor
- Virtual Network (includes Azure, GCP, and AWS)
- Subnet
- Region
- Tags: Select one or more tag keys from the list. SecureCloud applies a logical AND between the tags.
Each group can be used no more than once in the hierarchy, except for tags.
-
In the Group by definition, click
 .
.
-
Modify as required:
-
To change the group at any level, click the desired level and select an option from the list.
-
To remove a level, click the X on the appropriate level.
-
To add a new lowest level, click Add a level and select the appropriate group.
-
-
Click Save.
SecureCloud displays the graph from the first level. The Group by field reflects the changes.
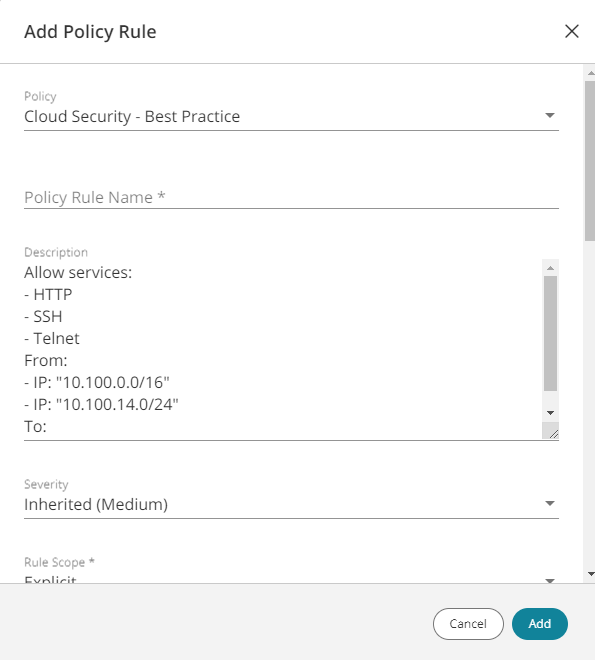
Create a Policy Rule from a Connection
Connections that do not show up as violations may not be covered by the Cloud Policy. This can be resolved by creating a policy rule from the connection.
Do not create policy rules to resolve violations. If a connection is violating the policy rule, edit the policy.
-
Click the relevant connection.
-
In the Connection Details panel, click
 .
.
The Add Policy Rule dialog box is displayed with an auto-generated rule.
-
In the Policy field, select an existing cloud policy.
-
Enter a Policy Rule Name.
-
Review the rule and click Add.
For more information, see Add a Policy Rule.
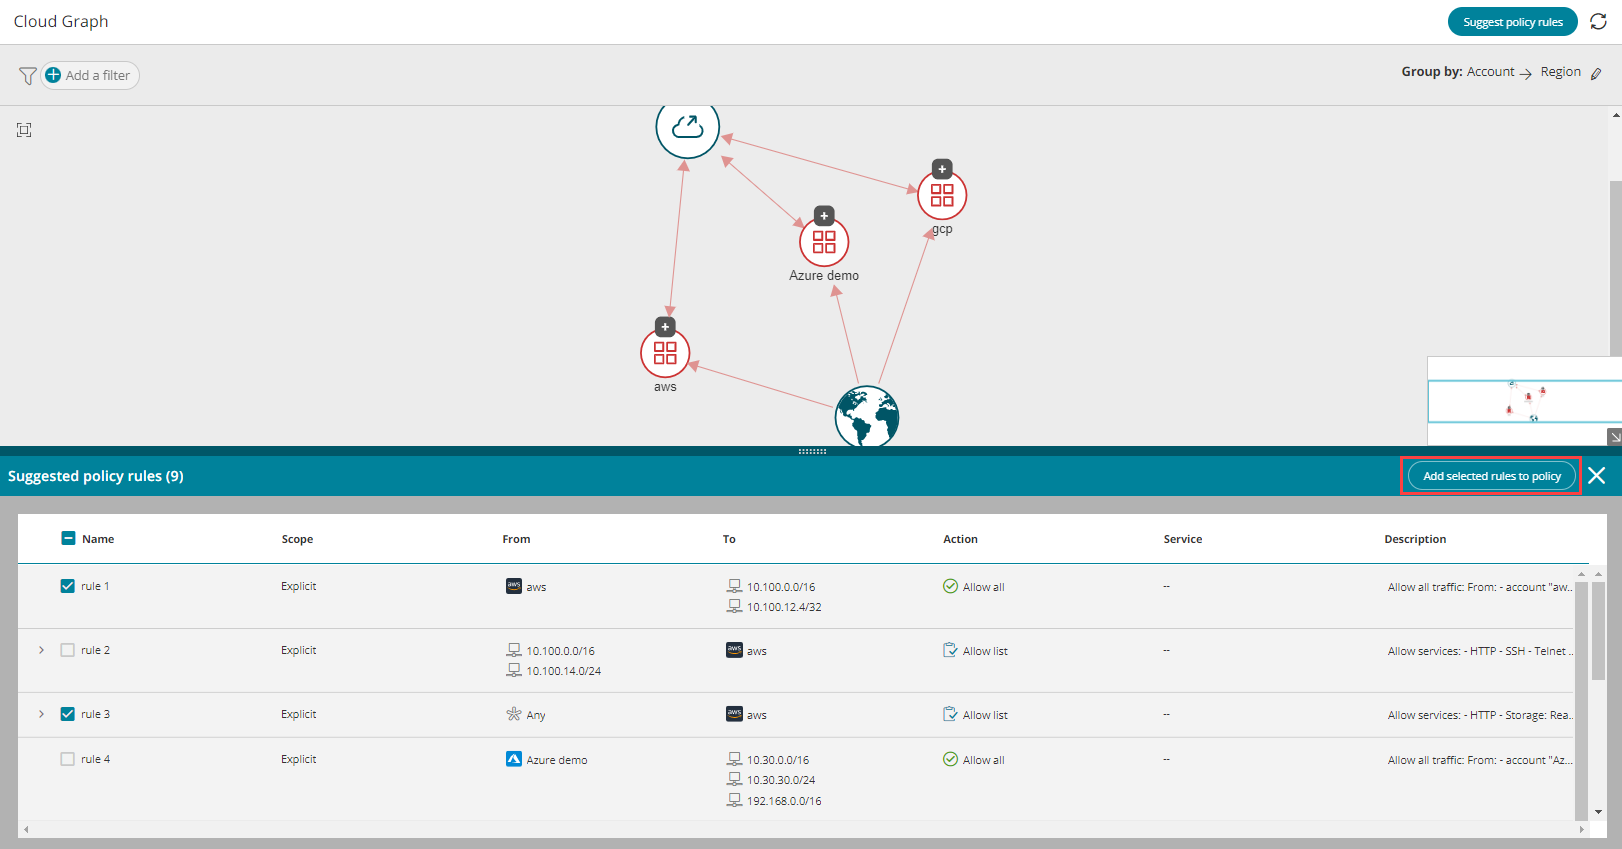
Select Rules to Import to Cloud Security Policy
For all connections in the Cloud Graph, SecureCloud can suggest rules that you can import to an existing or new cloud security policy. Details for each rule, including Scope, From, To, and a Description, appear in a panel below the graph.
-
Click Suggest policy rules.
-
Select the rules that you want to include in the cloud policy and click Add selected rules to policy.
How do I Get Here?
Main Menu > Cloud Graph
